CarMax 2010 Annual Report Download - page 79
Download and view the complete annual report
Please find page 79 of the 2010 CarMax annual report below. You can navigate through the pages in the report by either clicking on the pages listed below, or by using the keyword search tool below to find specific information within the annual report.-
 1
1 -
2
-
3
-
4
-
5
-
6
-
7
-
8
-
9
-
10
-
11
-
12
-
13
-
14
-
15
-
16
-
17
-
18
-
19
-
20
-
21
-
22
-
23
-
24
-
25
-
26
-
27
-
28
-
29
-
30
-
31
-
32
-
33
-
34
-
35
-
36
-
37
-
38
-
39
-
40
-
41
-
42
-
43
-
44
-
45
-
46
-
47
-
48
-
49
-
50
-
51
-
52
-
53
-
54
-
55
-
56
-
57
-
58
-
59
-
60
-
61
-
62
-
63
-
64
-
65
-
66
-
67
-
68
-
 69
69 -
 70
70 -
 71
71 -
 72
72 -
 73
73 -
 74
74 -
 75
75 -
 76
76 -
 77
77 -
 78
78 -
 79
79 -
 80
80 -
 81
81 -
 82
82 -
 83
83 -
 84
84 -
 85
85 -
 86
86 -
 87
87 -
 88
88 -
 89
89 -
90
-
91
-
92
-
93
-
94
-
95
-
96
 |
 |

69
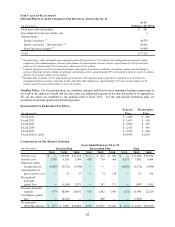
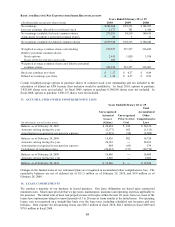
BASIC AND DILUTIVE NET EARNINGS PER SHARE RECONCILIATIONS
(In thousands except per share data) 2009
Net earnings 281,668$ 59,213$ 182,025$
Less net earnings allocable to restricted stock 2,377 703 1,410
Net earnings available for bas ic common s hares 279,291 58,510 180,615
Adjustment for dilutive potential common shares 29 5 25
Net earnings available for diluted common shares 279,320$ 58,515$ 180,640$
W eighted average common s hares outs tanding 219,527 217,537 216,045
Dilutive potential common shares:
Stock options 2,415 1,820 3,918
Stock-settled restricted stock units 292 ― ―
Weighted average common shares and dilutive potential
common s hares 222,234 219,357 219,963
Basic net earnings per share 1.27$ 0.27$ 0.84$
Diluted net earnings per share 1.26$ 0.27$ 0.82$
2010
Ye ar s Ende d Fe bruar y 2 8 or 2 9
2008
Certain weighted-average options to purchase shares of common stock were outstanding and not included in the
calculation of diluted net EPS because their inclusion would be antidilutive. In fiscal 2010, options to purchase
5,425,666 shares were not included. In fiscal 2009, options to purchase 8,340,996 shares were not included. In
fiscal 2008, options to purchase 1,586,357 shares were not included.
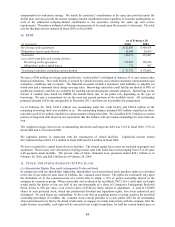
13. ACCUMULATED OTHER COMPREHENSIVE LOSS
(In thousands, net of income taxes)
Balance as of February 28, 2007 20,094$ 238$ 20,332$
Amounts arising during the year (2,177) 662 (1,515)
Amortization recognized in net pension expense (1,991) (98) (2,089)
Balance as of February 29, 2008 15,926 802 16,728
Amounts arising during the year 20,363 ― 20,363
Amortization recognized in net pension expense 604 (65) 539
Curtailment of retirement plans (20,033) (737) (20,770)
Balance as of February 28, 2009 16,860 ― 16,860
Amounts arising during the year 2,686 ― 2,686
Balance as of February 28, 2010 19,546$ ―$ 19,546$
Unrecognized
Actuarial
Loss es
(Gains )
Unrecognized
Prior Service
Cost
Total
Accumulated
Other
Comprehensive
Los s
Ye ar s Ende d Fe bruar y 2 8 or 2 9
Changes in the funded status of our retirement plans are recognized in accumulated other comprehensive loss. The
cumulative balances are net of deferred tax of $11.5 million as of February 28, 2010, and $9.9 million as of
February 28, 2009.
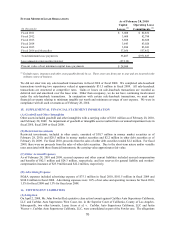
14. LEASE COMMITMENTS
We conduct a majority of our business in leased premises. Our lease obligations are based upon contractual
minimum rates. Most leases provide that we pay taxes, maintenance, insurance and operating expenses applicable to
the premises. The initial term of most real property leases will expire within the next 20 years; however, most of the
leases have options providing for renewal periods of 5 to 20 years at terms similar to the initial terms. For operating
leases, rent is recognized on a straight-line basis over the lease term, including scheduled rent increases and rent
holidays. Rent expense for all operating leases was $85.3 million in fiscal 2010, $82.1 million in fiscal 2009 and
$78.9 million in fiscal 2008.