CarMax 2010 Annual Report Download - page 34
Download and view the complete annual report
Please find page 34 of the 2010 CarMax annual report below. You can navigate through the pages in the report by either clicking on the pages listed below, or by using the keyword search tool below to find specific information within the annual report.-
 1
1 -
2
-
3
-
4
-
5
-
6
-
7
-
8
-
9
-
10
-
11
-
12
-
13
-
14
-
15
-
16
-
17
-
18
-
19
-
20
-
21
-
22
-
23
-
 24
24 -
 25
25 -
 26
26 -
 27
27 -
 28
28 -
 29
29 -
 30
30 -
 31
31 -
 32
32 -
 33
33 -
 34
34 -
 35
35 -
 36
36 -
 37
37 -
 38
38 -
 39
39 -
 40
40 -
 41
41 -
 42
42 -
 43
43 -
 44
44 -
45
-
46
-
47
-
48
-
49
-
50
-
51
-
52
-
53
-
54
-
55
-
56
-
57
-
58
-
59
-
60
-
61
-
62
-
63
-
64
-
65
-
66
-
67
-
68
-
69
-
70
-
71
-
72
-
73
-
74
-
75
-
76
-
77
-
78
-
79
-
80
-
81
-
82
-
83
-
84
-
85
-
86
-
87
-
88
-
89
-
90
-
91
-
92
-
93
-
94
-
95
-
96
 |
 |
24
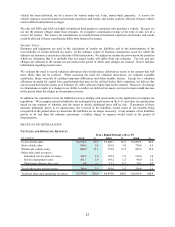
Our data indicated that we increased our share of the late-model used vehicle market by more than 10% in fiscal
2010, while the overall market contracted. We believe our ability to grow market share year after year is a testament
to the strength of our consumer offer and the preference for our brand.
Fiscal 2009 Versus Fiscal 2008. Our 14% decrease in used vehicle revenues in fiscal 2009 resulted from the
combination of an 8% decline in unit sales and a 6% decrease in average retail selling price. The decline in unit
sales reflected a 16% decrease in comparable store used units, partially offset by sales from newer superstores not
yet in the comparable store base. The decrease in the average retail selling price was primarily caused by a
significant industry-wide drop in wholesale used car prices during the first three quarters of the year, which reduced
our inventory acquisition costs. Early in fiscal 2009, the steep increase in the cost of gasoline caused a temporary
shift in consumer demand away from SUVs and trucks, toward more fuel-efficient vehicles. However, in the latter
half of fiscal 2009, the combination of the decline in gasoline prices and the lower, more affordable prices for these
less fuel-efficient vehicles caused our sales mix to return to the prior year levels.
We began to see the initial effects of the slowdown in the automotive retail market in the latter part of fiscal 2008.
However, the weakness in the economy and the stresses on consumer spending accelerated in fiscal 2009, causing
customer traffic to decline sharply starting in late May 2008. These stresses included rising unemployment rates,
decreases in home equity values and personal wealth, and record low levels of consumer confidence. For the year,
the decline in customer traffic was slightly greater than the decrease in comparable store unit sales. Despite the
more difficult environment, the solid execution by our store teams allowed us to modestly improve our conversion
rate compared with fiscal 2008. While both CAF and our third-party providers tightened lending criteria for some
higher-risk customer segments, lack of credit availability was not a major contributor to the reduction in sales in
fiscal 2009. Our data indicated that we modestly gained market share in the late-model used vehicle market in fiscal
2009.
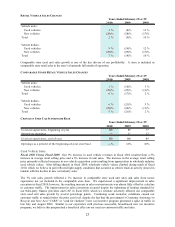
New Vehicle Sales
Fiscal 2010 Versus Fiscal 2009. New vehicle revenues declined 29% in fiscal 2010. The decrease was entirely the
result of a corresponding decline in unit sales, which primarily reflected the extremely soft new car industry sales
trends for the brands we represent. A reduction in sales volumes at our Chevrolet franchise, which is one of many
franchises being terminated by General Motors, also contributed to the decline in new vehicle unit sales. For the
fiscal year ended February 28, 2010, new car manufacturers reported a 15% decline in U.S. new car unit sales.
Fiscal 2009 Versus Fiscal 2008. New vehicle revenues declined 29% in fiscal 2009. The decline was the result of
a 28% decrease in unit sales and a 1% decrease in average selling price. New vehicle unit sales primarily reflected
the extremely soft new car industry sales trends, as well as the sale of our Orlando Chrysler-Jeep-Dodge franchise in
the second quarter of fiscal 2008. For the fiscal year ended February 28, 2009, new car manufacturers reported a
23% decline in U.S. new car unit sales.
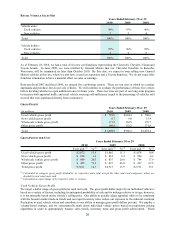
Wholesale Vehicle Sales
Our operating strategy is to build customer satisfaction by offering high-quality vehicles. Fewer than half of the
vehicles acquired from consumers through the appraisal purchase process meet our standards for reconditioning and
subsequent retail sale. Those vehicles that do not meet our standards are sold through on-site wholesale auctions.
Our wholesale auction prices usually reflect the trends in the general wholesale market for the types of vehicles we
sell, although they could also be affected by changes in vehicle mix or the average age, mileage or condition of the
vehicles wholesaled.
Fiscal 2010 Versus Fiscal 2009. The 8% increase in wholesale vehicle revenues in fiscal 2010 resulted from a 6%
increase in average wholesale vehicle selling price combined with a 2% increase in wholesale unit sales. The
increase in wholesale unit sales was mainly the result of a significant increase in our appraisal buy rate. We believe
the strong industry-wide wholesale vehicle pricing environment and the resulting increases in our appraisal offers
had a favorable effect on the buy rate. The benefit of the improvement in appraisal buy rate was largely offset,
however, by a double-digit decline in appraisal traffic, particularly in the first half of the year. Appraisal traffic was
adversely affected by both the slowdown in our customer traffic and by the reduction in new car industry sales and
the related used vehicle trade-in activity.
Fiscal 2009 Versus Fiscal 2008. The 21% decrease in wholesale vehicle revenues in fiscal 2009 resulted from a
13% decrease in wholesale unit sales combined with a 10% decrease in average wholesale vehicle selling price. The
decline in unit sales primarily reflected a decrease in our appraisal traffic and, to a lesser extent, a decline in our
appraisal buy rate. Appraisal traffic was affected by the overall slowdown in customer traffic. Industry wholesale