CarMax 2010 Annual Report Download - page 35
Download and view the complete annual report
Please find page 35 of the 2010 CarMax annual report below. You can navigate through the pages in the report by either clicking on the pages listed below, or by using the keyword search tool below to find specific information within the annual report.-
 1
1 -
2
-
3
-
4
-
5
-
6
-
7
-
8
-
9
-
10
-
11
-
12
-
13
-
14
-
15
-
16
-
17
-
18
-
19
-
20
-
21
-
22
-
23
-
24
-
 25
25 -
 26
26 -
 27
27 -
 28
28 -
 29
29 -
 30
30 -
 31
31 -
 32
32 -
 33
33 -
 34
34 -
 35
35 -
 36
36 -
 37
37 -
 38
38 -
 39
39 -
 40
40 -
 41
41 -
 42
42 -
 43
43 -
 44
44 -
 45
45 -
46
-
47
-
48
-
49
-
50
-
51
-
52
-
53
-
54
-
55
-
56
-
57
-
58
-
59
-
60
-
61
-
62
-
63
-
64
-
65
-
66
-
67
-
68
-
69
-
70
-
71
-
72
-
73
-
74
-
75
-
76
-
77
-
78
-
79
-
80
-
81
-
82
-
83
-
84
-
85
-
86
-
87
-
88
-
89
-
90
-
91
-
92
-
93
-
94
-
95
-
96
 |
 |

25
prices for SUVs, trucks and other less fuel efficient vehicles fell sharply in the first two quarters of fiscal 2009, and
prices for virtually all vehicle classes declined at an unprecedented rate during the third quarter, reflecting the weak
demand environment. We believe the significant drop in wholesale market values, which resulted in corresponding
decreases in our appraisal offers, contributed to the reduction in our buy rate.
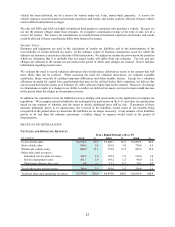
Other Sales and Revenues
Other sales and revenues include commissions on the sale of ESPs and GAP (reported in ESP revenues), service
department sales and net third-party finance fees. The fixed fees paid by third-party finance providers vary by
provider, reflecting their differing levels of credit risk exposure. The third-party provider who purchases subprime
financings purchases these loans at a discount, which is reflected as an offset to finance fee revenues received from
the other third-party providers.
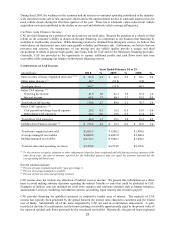
Fiscal 2010 Versus Fiscal 2009. Other sales and revenues increased 2% in fiscal 2010. The increase was
comprised of a 15% increase in ESP revenues, largely offset by a 94% decline in third-party finance fees. ESP
revenues benefited from the 3% increase in used unit sales and the successful introduction of GAP in fiscal 2010. In
addition, fiscal 2010 ESP revenues benefited from modifications in pricing made during the second half of fiscal
2009. The decline in third-party finance fees primarily reflected a mix shift among providers, which increased the
percentage of vehicle sales financed by the subprime provider. The subprime provider financed approximately 6%
of our retail unit sales in fiscal 2010 compared with approximately 3% in fiscal 2009. In addition, during the third
quarter of fiscal 2010, we curtailed our temporary strategy of routing a larger percentage of credit applications
directly to the third-party finance providers. We had originally implemented this practice in the third quarter of
fiscal 2009 in order to slow the use of capacity in our warehouse facility during a period when the asset-backed
securitization markets were severely disrupted. The warehouse facility is used to provide initial funding for
substantially all of the auto loan receivables originated by CAF.
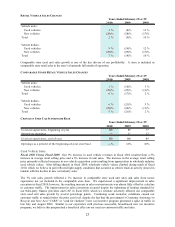
Fiscal 2009 Versus Fiscal 2008. Other sales and revenues decreased 5% in fiscal 2009. ESP revenues declined
5%. Compared with the 8% decrease in total used vehicle unit sales in fiscal 2009, ESP revenues benefited from a
slow down in the rate of ESP cancellations, which we believe was the result of the decline in auto industry sales and
trade-ins. Third-party finance fees decreased 42% due to a combination of factors including the reduction in retail
vehicle unit sales, a shift in mix among providers and a change in discount arrangements with certain of the
providers during fiscal 2009. Collectively, the third-party providers financed a larger percentage of our retail unit
sales in the second half of fiscal 2009, as we chose to route more credit applications to these providers in order to
slow the use of capacity in our warehouse facility.
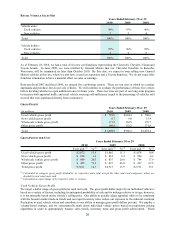
Supplemental Sales Information
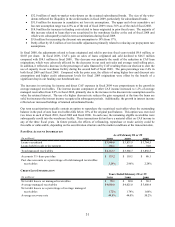
UNIT SALES
Us ed vehicles 357,129 345,465 377,244
New vehicles 7,851 11,084 15,485
Wholes ale vehicles 197,382 194,081 222,406
2009
Year s Ende d Fe br uar y 2 8 or 2 9
20082010
AVERAGE SELLING PRICES
Used vehicles 17,152$ 16,291$ 17,298$
New vehicles 23,617$ 23,490$ 23,795$
Wholesale vehicles 4,155$ 3,902$ 4,319$
Year s Ende d Fe br uar y 2 8 or 2 9
2009 20082010