CarMax 2010 Annual Report Download - page 61
Download and view the complete annual report
Please find page 61 of the 2010 CarMax annual report below. You can navigate through the pages in the report by either clicking on the pages listed below, or by using the keyword search tool below to find specific information within the annual report.-
 1
1 -
2
-
3
-
4
-
5
-
6
-
7
-
8
-
9
-
10
-
11
-
12
-
13
-
14
-
15
-
16
-
17
-
18
-
19
-
20
-
21
-
22
-
23
-
24
-
25
-
26
-
27
-
28
-
29
-
30
-
31
-
32
-
33
-
34
-
35
-
36
-
37
-
38
-
39
-
40
-
41
-
42
-
43
-
44
-
45
-
46
-
47
-
48
-
49
-
50
-
 51
51 -
 52
52 -
 53
53 -
 54
54 -
 55
55 -
 56
56 -
 57
57 -
 58
58 -
 59
59 -
 60
60 -
 61
61 -
 62
62 -
 63
63 -
 64
64 -
 65
65 -
 66
66 -
 67
67 -
 68
68 -
 69
69 -
 70
70 -
 71
71 -
72
-
73
-
74
-
75
-
76
-
77
-
78
-
79
-
80
-
81
-
82
-
83
-
84
-
85
-
86
-
87
-
88
-
89
-
90
-
91
-
92
-
93
-
94
-
95
-
96
 |
 |
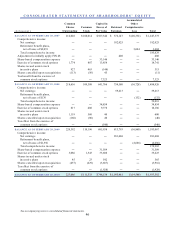
51
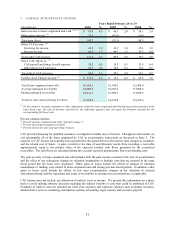
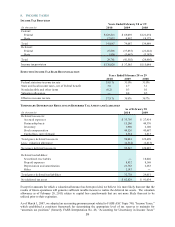
3. CARMAX AUTO FINANCE INCOME
(In millions) %%
Gain on s ales of loans originated and s old
(1)(2)
83.0$ 4.5 46.5$ 2.4 58.1$ 2.4
Other gains (losses)
(1)
26.7 (81.8) (9.6)
Total gain (loss) 109.7 (35.3) 48.5
Other CAF income:
(3)
Servicing fee income 41.9 1.0 41.3 1.0 37.4 1.0
Interest income 68.5 1.7 48.3 1.2 33.3 0.9
Total other CAF income 110.4 2.7 89.6 2.2 70.7 2.0
Direct CAF expenses:
(3)
CAF payroll and fringe benefit expens e 20.2 0.5 19.2 0.5 15.9 0.4
Other direct CAF expenses 24.7 0.6 19.9 0.5 17.4 0.5
Total direct CAF expenses 44.9 1.1 39.1 1.0 33.3 0.9
CarMax Auto Finance income
(4)
175.2$ 2.3 15.3$ 0.2 85.9$ 1.0
Total loans originated and s old 1,855.3$ 1,930.2$ 2,430.8$
Average managed receivables 4,080.0$ 4,021.0$ 3,608.4$
Ending managed receivables 4,112.7$ 3,986.7$ 3,838.5$
Total net s ales and operating revenues 7,470.2$ 6,974.0$ 8,199.6$
Year s Ende d Fe bruar y 2 8 or 2 9
2010 2009 2008 %
(1) To the extent we recognize valuation or other adjustments related to loans originated and sold during previous quarters of the
same fiscal year, the sum of amounts reported for the individual quarters may not equal the amounts reported for the
corresponding full fiscal year.
Percent columns indicate:
(2) Percent of loans originated and sold (“gain percentage”).
(3) Percent of average managed receivables.
(4) Percent of total net sales and operating revenues.
CAF provides financing for qualified customers at competitive market rates of interest. Throughout each month, we
sell substantially all of the loans originated by CAF in securitization transactions as discussed in Note 4. The
majority of CAF income has typically been generated by the spread between the interest rates charged to customers
and the related cost of funds. A gain, recorded at the time of securitization, results from recording a receivable
approximately equal to the present value of the expected residual cash flows generated by the securitized
receivables. The cash flows are calculated taking into account expected prepayments, losses and funding costs.
The gain on sales of loans originated and sold includes both the gain income recorded at the time of securitization
and the effect of any subsequent changes in valuation assumptions or funding costs that are incurred in the same
fiscal period that the loans were originated. Other gains or losses include the effects of changes in valuation
assumptions or funding costs related to loans originated and sold during previous fiscal periods. In addition, other
gains or losses could include the effects of new term securitizations, changes in the valuation of retained
subordinated bonds and the repurchase and resale of receivables in existing term securitizations, as applicable.
CAF income does not include any allocation of indirect costs or income. We present this information on a direct
basis to avoid making arbitrary decisions regarding the indirect benefits or costs that could be attributed to CAF.
Examples of indirect costs not included are retail store expenses and corporate expenses such as human resources,
administrative services, marketing, information systems, accounting, legal, treasury and executive payroll.