CarMax 2010 Annual Report Download - page 40
Download and view the complete annual report
Please find page 40 of the 2010 CarMax annual report below. You can navigate through the pages in the report by either clicking on the pages listed below, or by using the keyword search tool below to find specific information within the annual report.-
 1
1 -
2
-
3
-
4
-
5
-
6
-
7
-
8
-
9
-
10
-
11
-
12
-
13
-
14
-
15
-
16
-
17
-
18
-
19
-
20
-
21
-
22
-
23
-
24
-
25
-
26
-
27
-
28
-
29
-
 30
30 -
 31
31 -
 32
32 -
 33
33 -
 34
34 -
 35
35 -
 36
36 -
 37
37 -
 38
38 -
 39
39 -
 40
40 -
 41
41 -
 42
42 -
 43
43 -
 44
44 -
 45
45 -
 46
46 -
 47
47 -
 48
48 -
 49
49 -
 50
50 -
51
-
52
-
53
-
54
-
55
-
56
-
57
-
58
-
59
-
60
-
61
-
62
-
63
-
64
-
65
-
66
-
67
-
68
-
69
-
70
-
71
-
72
-
73
-
74
-
75
-
76
-
77
-
78
-
79
-
80
-
81
-
82
-
83
-
84
-
85
-
86
-
87
-
88
-
89
-
90
-
91
-
92
-
93
-
94
-
95
-
96
 |
 |
30
and sold as a percent of loans originated and sold (the “gain percentage”) has generally been in the range of 3.5% to
4.5%. However, the gain percentage was substantially below the low end of this range in fiscal 2009 and fiscal
2008, primarily as a result of the more challenging economic environment and the disruption in the global credit
markets. These factors caused us to increase the loss and discount rate assumptions that affect the gain recognized
on the sale of loans, and they increased our funding costs.
The gain on sales of loans originated and sold includes both the gain income recorded at the time of securitization
and the effect of any subsequent changes in valuation assumptions or funding costs that are incurred in the same
fiscal period that the loans were originated. Other losses or gains include the effects of changes in valuation
assumptions or funding costs related to loans originated and sold during previous fiscal periods. In addition, other
losses or gains could include the effects of new term securitizations, changes in the valuation of retained
subordinated bonds and the repurchase and resale of receivables in existing term securitizations, as applicable.
Between January 2008 and April 2009, we retained some or all of the subordinated bonds associated with our term
securitizations. We retained these subordinated bonds because, at the applicable issue date, the economics of doing
so were more favorable than selling them. During fiscal 2010, we retained subordinated bonds in connection with
the April 2009 securitization of $1.0 billion of auto loans. These subordinated bonds were issued at a discount and
had a fair value of $123.0 million as of February 28, 2010. Retained subordinated bonds are included in retained
interest in securitized receivables on our consolidated balance sheets, and their total fair value was $248.8 million as
of February 28, 2010, $87.4 million as of February 28, 2009, and $43.1 million as of February 29, 2008. Changes in
the fair value of the retained subordinated bonds are reflected in CAF income.
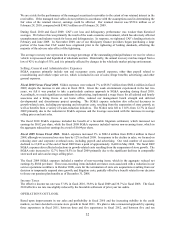
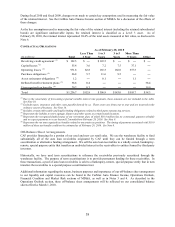
Fiscal 2010 Versus Fiscal 2009. CAF income increased to $175.2 million from $15.3 million in fiscal 2009. In
both periods, CAF results were affected by adjustments related to loans originated in previous fiscal years. In fiscal
2010, the adjustments increased CAF income by $26.7 million, or $0.07 per share, while in fiscal 2009, the
adjustments reduced CAF income by $81.8 million, or $0.23 per share. The fiscal 2010 adjustments included:
• $64.0 million of favorable mark-to-market adjustments primarily on retained subordinated bonds resulting
from improvements in credit market conditions and an increase in demand for these securities.
• $14.8 million of net favorable valuation adjustments primarily related to decreases in prepayment rate
assumptions.
• $4.1 million of favorable valuation adjustments related to reducing the discount rate assumption on select
pools of loans.
• Partly offset by a $56.2 million increase in funding costs largely related to the $1.22 billion of auto loan
receivables that were funded in the warehouse facility at the end of fiscal 2009. The majority of this
increase in funding costs was associated with the term securitization completed in April 2009.
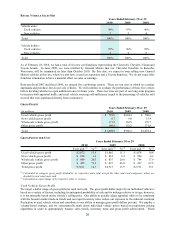
Excluding the adjustments from both periods, CAF income increased to $148.6 million from $97.0 million in fiscal
2009. CAF’s gain on loans originated and sold climbed to $83.0 million from $46.5 million in fiscal 2009. The
increase primarily reflected a significant improvement in the gain percentage, partially offset by a reduction in the
volume of loans originated and sold. The gain percentage increased to 4.5% in fiscal 2010 from 2.4% in fiscal 2009.
Several factors contributed to this improvement. The spread between the rates charged customers and CAF’s
funding costs increased, largely due to lower benchmark rates. In addition, CAF’s tightening of lending standards
had a favorable effect on the expected net loss and discount rate assumptions used to value the related gain income
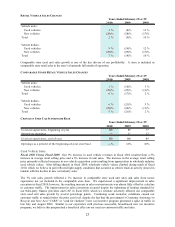
and on the required credit enhancements. The volume of CAF loans originated and sold declined 4% to $1.86
billion from $1.93 billion in fiscal 2009, mainly reflecting a decline in the percentage of sales financed by CAF. Net
of 3-day payoffs, the number of units financed by CAF as a percentage of total retail unit sales (the “penetration
rate”) fell to slightly below 30% from 32% in fiscal 2009, primarily reflecting CAF’s tightening of lending
standards.
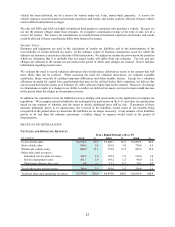
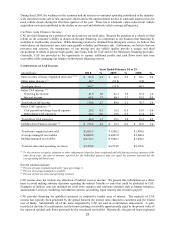
The increases in servicing fee income and direct CAF expenses in fiscal 2010 were proportionate to the growth in
average managed receivables. The interest income component of other CAF income, which increased to 1.7% of
average managed receivables from 1.2% in fiscal 2009, includes the interest earned on the retained subordinated
bonds. This growth in interest income primarily resulted from our increased holdings of retained subordinated
bonds and higher yields on the subordinated bonds retained in connection with the April 2009 securitization.
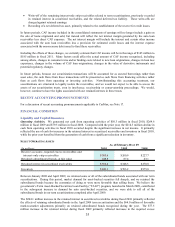
Fiscal 2009 Versus Fiscal 2008. CAF income declined to $15.3 million from $85.9 million in fiscal 2008. In both
periods, CAF income was reduced by adjustments related to loans originated in previous fiscal years. In fiscal 2009,
these adjustments totaled $81.8 million, or $0.23 per share, and they included: