CarMax 2010 Annual Report Download - page 36
Download and view the complete annual report
Please find page 36 of the 2010 CarMax annual report below. You can navigate through the pages in the report by either clicking on the pages listed below, or by using the keyword search tool below to find specific information within the annual report.-
 1
1 -
2
-
3
-
4
-
5
-
6
-
7
-
8
-
9
-
10
-
11
-
12
-
13
-
14
-
15
-
16
-
17
-
18
-
19
-
20
-
21
-
22
-
23
-
24
-
25
-
 26
26 -
 27
27 -
 28
28 -
 29
29 -
 30
30 -
 31
31 -
 32
32 -
 33
33 -
 34
34 -
 35
35 -
 36
36 -
 37
37 -
 38
38 -
 39
39 -
 40
40 -
 41
41 -
 42
42 -
 43
43 -
 44
44 -
 45
45 -
 46
46 -
47
-
48
-
49
-
50
-
51
-
52
-
53
-
54
-
55
-
56
-
57
-
58
-
59
-
60
-
61
-
62
-
63
-
64
-
65
-
66
-
67
-
68
-
69
-
70
-
71
-
72
-
73
-
74
-
75
-
76
-
77
-
78
-
79
-
80
-
81
-
82
-
83
-
84
-
85
-
86
-
87
-
88
-
89
-
90
-
91
-
92
-
93
-
94
-
95
-
96
 |
 |

26
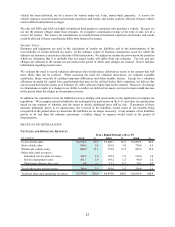
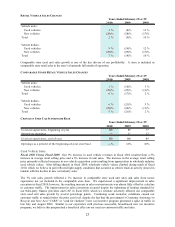
RETAIL VEHICLE SALES MIX
Vehicle units:
Us ed vehicles 98% 97% 96%
New vehicles 2 3 4
Total 100% 100% 100%
Vehicle dollars:
Us ed vehicles 97% 96% 95%
New vehicles 3 4 5
Total 100% 100% 100%
2010 2009 2008
Year s Ende d Fe bruar y 2 8 or 2 9
As of February 28, 2010, we had a total of six new car franchises representing the Chevrolet, Chrysler, Nissan and
Toyota brands. In June 2009, we were notified by General Motors that our Chevrolet franchise in Kenosha,
Wisconsin, will be terminated no later than October 2010. By this date, we expect to stop selling new General
Motors vehicles at this site, where we also have a used car superstore and a Toyota franchise. We do not expect this
franchise termination to have a material effect on sales or earnings.
Between fiscal 2007 and fiscal 2009, we opened five car-buying centers. These are test sites at which we conduct
appraisals and purchase, but do not sell, vehicles. We will continue to evaluate the performance of these five centers
before deciding whether to open additional ones in future years. These test sites are part of our long-term program
to increase both appraisal traffic and retail vehicle sourcing self-sufficiency (equal to the percentage of vehicles sold
at retail that were purchased directly from consumers).
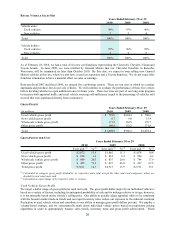
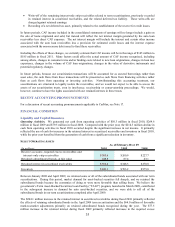
GROSS PROFIT
(In millions)
Us ed vehicle gross profit 739.9$ 644.4$ 708.6$
New vehicle gross profit 6.7 9.0 15.4
Wholesale vehicle gross profit 171.5 162.5 176.7
Other gros s profit 180.8 152.2 171.8
Total 1,098.9$ 968.2$ 1,072.4$
20082010
Years Ended February 28 or 29
2009
GROSS PROFIT PER UNIT
%
(2)
%
(2)
%
(2)
Used vehicle gross profit 2,072$ 11.9 1,865$ 11.3 1,878$ 10.8
New vehicle gross profit 858$ 3.6 814$ 3.4 994$ 4.2
Wholesale vehicle gross profit 869$ 20.3 837$ 20.8 794$ 17.9
Other gross profit 495$ 73.3 427$ 63.0 437$ 67.5
Total gross profit 3,011$ 14.7 2,715$ 13.9 2,731$ 13.1
2008
$ per unit
(1)
$ per unit
(1)
$ per unit
(1)
2010 2009
Years Ended February 28 or 29
(1) Calculated as category gross profit divided by its respective units sold, except the other and total categories, which are
divided by total retail units sold.
(2) Calculated as a percentage of its respective sales or revenue.
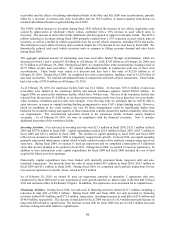
Used Vehicle Gross Profit
We target a dollar range of gross profit per used unit sold. The gross profit dollar target for an individual vehicle is
based on a variety of factors, including its anticipated probability of sale and its mileage relative to its age; however,
it is not primarily based on the vehicle’s selling price. Our ability to quickly adjust appraisal offers to be consistent
with the broader market trade-in trends and our rapid inventory turns reduce our exposure to the inherent continual
fluctuation in used vehicle values and contribute to our ability to manage gross profit dollars per unit. We employ a
volume-based strategy, and we systematically mark down individual vehicle prices based on proprietary pricing
algorithms in order to appropriately balance sales trends, inventory turns and gross profit achievement. When