CarMax 2010 Annual Report Download - page 38
Download and view the complete annual report
Please find page 38 of the 2010 CarMax annual report below. You can navigate through the pages in the report by either clicking on the pages listed below, or by using the keyword search tool below to find specific information within the annual report.-
 1
1 -
2
-
3
-
4
-
5
-
6
-
7
-
8
-
9
-
10
-
11
-
12
-
13
-
14
-
15
-
16
-
17
-
18
-
19
-
20
-
21
-
22
-
23
-
24
-
25
-
26
-
27
-
 28
28 -
 29
29 -
 30
30 -
 31
31 -
 32
32 -
 33
33 -
 34
34 -
 35
35 -
 36
36 -
 37
37 -
 38
38 -
 39
39 -
 40
40 -
 41
41 -
 42
42 -
 43
43 -
 44
44 -
 45
45 -
 46
46 -
 47
47 -
 48
48 -
49
-
50
-
51
-
52
-
53
-
54
-
55
-
56
-
57
-
58
-
59
-
60
-
61
-
62
-
63
-
64
-
65
-
66
-
67
-
68
-
69
-
70
-
71
-
72
-
73
-
74
-
75
-
76
-
77
-
78
-
79
-
80
-
81
-
82
-
83
-
84
-
85
-
86
-
87
-
88
-
89
-
90
-
91
-
92
-
93
-
94
-
95
-
96
 |
 |
28
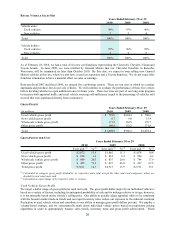
Wholesale Vehicle Gross Profit
Our wholesale vehicle gross profit per unit has steadily increased over the last several years, in part, reflecting the
benefits realized from improvements and refinements in our car-buying strategies, appraisal delivery processes and
in-store auction processes. We have made continuous improvements in these processes, which we believe has
allowed us to become more efficient. Our in-store auctions have benefited from initiatives to increase our dealer-to-
car ratio, which we believe has allowed us to achieve higher prices. In addition, the frequency of our auctions,
which are generally held weekly or bi-weekly, minimizes the depreciation risk on these vehicles.
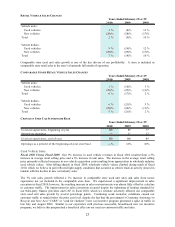
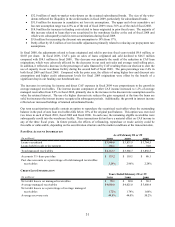
Fiscal 2010 Versus Fiscal 2009. Our wholesale vehicle gross profit increased by $8.9 million, or 5%, to $171.5
million from $162.5 million in fiscal 2009, reflecting the combination of a 4% improvement in wholesale vehicle
gross profit per unit and the 2% increase in wholesale unit sales. Wholesale gross profit per unit increased $32 to
$869 per unit compared with $837 per unit in fiscal 2009. The improvement in the wholesale vehicle gross profit
per unit primarily reflected the higher year-over-year wholesale pricing environment. We also achieved a new
record dealer-to-car ratio at our auctions in fiscal 2010, with the resulting price competition among bidders
contributing to the strong wholesale gross profit per unit.
Fiscal 2009 Versus Fiscal 2008. Our wholesale vehicle gross profit decreased by $14.2 million, or 8%, to $162.5
million from $176.7 million in fiscal 2008. The reduction was driven by the 13% decline in wholesale vehicle unit
sales, partially offset by an increase in wholesale gross profit per unit of $43, or 5%, to $837 per unit from $794 per
unit in fiscal 2008. We experienced an improvement in our dealer-to-car ratio at our auctions in fiscal 2009, with
the resulting price competition among bidders contributing to the strong wholesale gross profit per unit. Our
wholesale vehicles are predominantly comprised of older, higher mileage vehicles, and we believe the demand for
these types of vehicles remained strong from dealers who specialize in selling to credit-challenged customers.
Other Gross Profit
Other gross profit includes profits related to ESP and GAP revenues, net third-party finance fees and service
department sales. We have no cost of sales related to ESP and GAP revenues or net third-party finance fees, as
these represent commissions paid to us by the third-party providers. Accordingly, changes in the relative mix of the
other gross profit components can affect the composition of other gross profit.
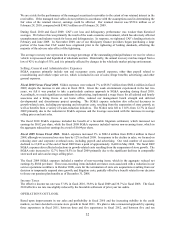
Fiscal 2010 Versus Fiscal 2009. Other gross profit increased by $28.6 million, or 19%, to $180.8 million from
$152.2 million in fiscal 2009. Other gross profit per unit increased $68, or 16%, to $495 per unit from $427 per unit
in fiscal 2009. ESP gross profit increased $19.3 million, or 15%, benefiting from the introduction of GAP, the
modifications in pricing made during the second half of fiscal 2009 and the 3% increase in used unit sales. Service
department gross profit grew $23.6 million, primarily because our retail vehicle sale growth outpaced fixed service
overhead costs. The increases in ESP and service department gross profit were partially offset by a $14.3 million
reduction in net third-party finance fees, which were adversely affected by the mix shift among providers and the
termination of our temporary practice of reducing CAF originations by routing more credit applications to our third-
party providers.
Fiscal 2009 Versus Fiscal 2008. Other gross profit decreased by $19.6 million, or 11%, to $152.2 million from
$171.8 million in fiscal 2008. This decrease primarily reflected the reductions in used and new retail unit sales and
the related impact on ESP revenues and third-party finance fees and a $10 decline in other gross profit per unit in
fiscal 2009. The decline in other gross profit per unit was primarily associated with the increase in mix of other
revenues represented by service department sales.
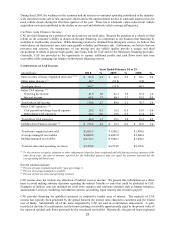
Impact of Inflation
Historically, inflation has not been a significant contributor to results. Profitability is primarily affected by our
ability to achieve targeted unit sales and gross profit dollars per vehicle rather than on average retail prices.
However, increases in average vehicle selling prices benefit the SG&A ratio and CAF income, to the extent the
average amount financed also increases.
During fiscal 2010, we experienced a period of strong appreciation in used vehicle wholesale pricing. We believe
the appreciation resulted, in part, from a reduced supply of used vehicles in the market that was caused by the
dramatic decline in new car industry sales and the associated slow down in used vehicle trade-in activity. The
appreciation also reflected a rebound in pricing compared with the severe depreciation experienced in the previous
year. The higher wholesale values increased both our vehicle acquisition costs and our average selling prices for
used and wholesale vehicles.