CarMax 2010 Annual Report Download - page 32
Download and view the complete annual report
Please find page 32 of the 2010 CarMax annual report below. You can navigate through the pages in the report by either clicking on the pages listed below, or by using the keyword search tool below to find specific information within the annual report.-
 1
1 -
2
-
3
-
4
-
5
-
6
-
7
-
8
-
9
-
10
-
11
-
12
-
13
-
14
-
15
-
16
-
17
-
18
-
19
-
20
-
21
-
 22
22 -
 23
23 -
 24
24 -
 25
25 -
 26
26 -
 27
27 -
 28
28 -
 29
29 -
 30
30 -
 31
31 -
 32
32 -
 33
33 -
 34
34 -
 35
35 -
 36
36 -
 37
37 -
 38
38 -
 39
39 -
 40
40 -
 41
41 -
 42
42 -
43
-
44
-
45
-
46
-
47
-
48
-
49
-
50
-
51
-
52
-
53
-
54
-
55
-
56
-
57
-
58
-
59
-
60
-
61
-
62
-
63
-
64
-
65
-
66
-
67
-
68
-
69
-
70
-
71
-
72
-
73
-
74
-
75
-
76
-
77
-
78
-
79
-
80
-
81
-
82
-
83
-
84
-
85
-
86
-
87
-
88
-
89
-
90
-
91
-
92
-
93
-
94
-
95
-
96
 |
 |

22
vehicle has been delivered, net of a reserve for returns under our 5-day, money-back guarantee. A reserve for
vehicle returns is recorded based on historical experience and trends, and results could be affected if future vehicle
returns differ from historical averages.
We also sell ESPs and GAP on behalf of unrelated third parties to customers who purchase a vehicle. Because we
are not the primary obligor under these products, we recognize commission revenue at the time of sale, net of a
reserve for returns. The reserve for cancellations is recorded based on historical experience and trends, and results
could be affected if future cancellations differ from historical averages.
Income Taxes
Estimates and judgments are used in the calculation of certain tax liabilities and in the determination of the
recoverability of certain deferred tax assets. In the ordinary course of business, transactions occur for which the
ultimate tax outcome is uncertain at the time of the transactions. We adjust our income tax provision in the period in
which we determine that it is probable that our actual results will differ from our estimates. Tax law and rate
changes are reflected in the income tax provision in the period in which such changes are enacted. Note 8 includes
information regarding income taxes.
We evaluate the need to record valuation allowances that would reduce deferred tax assets to the amount that will
more likely than not be realized. When assessing the need for valuation allowances, we consider available
carrybacks, future reversals of existing temporary differences and future taxable income. Except for a valuation
allowance recorded for capital loss carryforwards that may not be utilized before their expiration, we believe that
our recorded deferred tax assets as of February 28, 2010, will more likely than not be realized. However, if a change
in circumstances results in a change in our ability to realize our deferred tax assets, our tax provision would increase
in the period when the change in circumstances occurs.
In addition, the calculation of our tax liabilities involves dealing with uncertainties in the application of complex tax
regulations. We recognize potential liabilities for anticipated tax audit issues in the U.S. and other tax jurisdictions
based on our estimate of whether, and the extent to which, additional taxes will be due. If payments of these
amounts ultimately prove to be unnecessary, the reversal of the liabilities would result in tax benefits being
recognized in the period when we determine the liabilities are no longer necessary. If our estimate of tax liabilities
proves to be less than the ultimate assessment, a further charge to expense would result in the period of
determination.
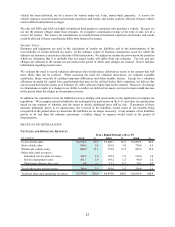
RESULTS OF OPERATIONS
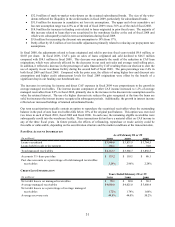
NET SALES AND OPERATING REVENUES
(In millions)
%%%
Used vehicle sales 6,192.3$ 82.9 5,690.7$ 81.6 6,589.3$ 80.4
New vehicle sales 186.5 2.5 261.9 3.8 370.6 4.5
Wholesale vehicle sales 844.9 11.3 779.8 11.2 985.0 12.0
Other sales and revenues:
Extended service plan revenues 144.5 1.9 125.2 1.8 132.4 1.6
Service department sales 101.1 1.4 101.2 1.5 96.0 1.2
Third-party finance fees, net 0.9 ― 15.3 0.2 26.1 0.3
Total other sales and revenues 246.6 3.3 241.6 3.5 254.6 3.1
Total net sales and operating revenues 7,470.2$ 100.0 6,974.0$ 100.0 8,199.6$ 100.0
Year s Ende d Fe br uar y 2 8 or 2 9
2009 20082010