CarMax 2010 Annual Report Download - page 33
Download and view the complete annual report
Please find page 33 of the 2010 CarMax annual report below. You can navigate through the pages in the report by either clicking on the pages listed below, or by using the keyword search tool below to find specific information within the annual report.-
 1
1 -
2
-
3
-
4
-
5
-
6
-
7
-
8
-
9
-
10
-
11
-
12
-
13
-
14
-
15
-
16
-
17
-
18
-
19
-
20
-
21
-
22
-
 23
23 -
 24
24 -
 25
25 -
 26
26 -
 27
27 -
 28
28 -
 29
29 -
 30
30 -
 31
31 -
 32
32 -
 33
33 -
 34
34 -
 35
35 -
 36
36 -
 37
37 -
 38
38 -
 39
39 -
 40
40 -
 41
41 -
 42
42 -
 43
43 -
44
-
45
-
46
-
47
-
48
-
49
-
50
-
51
-
52
-
53
-
54
-
55
-
56
-
57
-
58
-
59
-
60
-
61
-
62
-
63
-
64
-
65
-
66
-
67
-
68
-
69
-
70
-
71
-
72
-
73
-
74
-
75
-
76
-
77
-
78
-
79
-
80
-
81
-
82
-
83
-
84
-
85
-
86
-
87
-
88
-
89
-
90
-
91
-
92
-
93
-
94
-
95
-
96
 |
 |

23
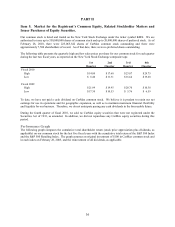
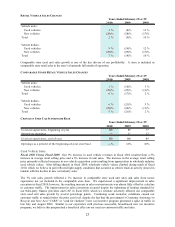
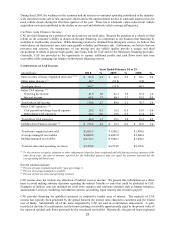
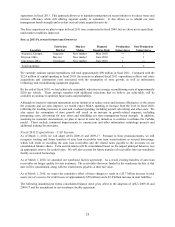
RETAIL VEHICLE SALES CHANGES
Vehicle units:
Used vehicles 3 % (8)% 12 %
New vehicles (29)% (28)% (17)%
Total 2 % (9)% 10 %
Vehicle dollars:
Used vehicles 9 % (14)% 12 %
New vehicles (29)% (29)% (17)%
Total 7 % (14)% 10 %
2009 20082010
Year s Ende d Fe br uar y 2 8 or 2 9
Comparable store used unit sales growth is one of the key drivers of our profitability. A store is included in
comparable store retail sales in the store’s fourteenth full month of operation.
COMPARABLE STORE RETAIL VEHICLE SALES CHANGES
Vehicle units:
Used vehicles 1 % (16)% 3 %
New vehicles (29)% (25)% (11)%
Total 0 % (17)% 2 %
Vehicle dollars:
Used vehicles 6 % (21)% 3 %
New vehicles (29)% (26)% (11)%
Total 5 % (21)% 2 %
Year s Ende d Fe br uar y 2 8 or 2 9
20082010 2009
CHANGE IN USED CAR SUPERSTORE BASE
Used car superstores, beginning of year 100 89 77
Superstore openings ― 11 12
Used car superstores, end of year 100 100 89
Openings as a percent of the beginning-of-year store base ―% 12% 16%
20092010 2008
Year s Ende d Fe bruar y 2 8 or 2 9
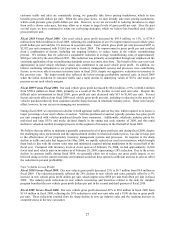
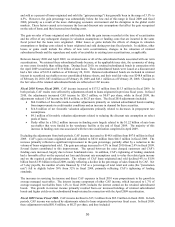
Used Vehicle Sales
Fiscal 2010 Versus Fiscal 2009. Our 9% increase in used vehicle revenues in fiscal 2010 resulted from a 5%
increase in average retail selling price and a 3% increase in unit sales. The increase in the average retail selling
price primarily reflected increases in our vehicle acquisition costs resulting from appreciation in wholesale industry
used vehicle values. After falling sharply in fiscal 2009, wholesale vehicle values climbed during much of fiscal
2010, which we believe in part reflected tight supply conditions that occurred as vehicle trade-in activity slowed in
tandem with the decline in new car industry sales.
The 3% unit sales growth reflected a 1% increase in comparable store used unit sales and sales from newer
superstores not yet included in the comparable store base. We experienced a significant improvement in sales
execution in fiscal 2010; however, the resulting increase in sales conversion rate was almost fully offset by a decline
in customer traffic. The improvement in sales conversion occurred despite the tightening of lending standards by
our third-party finance providers and CAF in fiscal 2010, which we estimate adversely affected our comparable
store used unit sales growth by several percentage points. Continuing weak economic conditions caused our
customer traffic to remain below the prior year level, despite the fact that the government’s Consumer Assistance to
Recycle and Save Act (“CARS” or “cash for clunkers”) new car incentive program generated a spike in traffic in
late July and August 2009. Similar to our experience with previous successful, broad-based new car incentive
programs, we believe this program had a beneficial effect on our used car customer traffic and sales.