CarMax 2010 Annual Report Download - page 39
Download and view the complete annual report
Please find page 39 of the 2010 CarMax annual report below. You can navigate through the pages in the report by either clicking on the pages listed below, or by using the keyword search tool below to find specific information within the annual report.-
 1
1 -
2
-
3
-
4
-
5
-
6
-
7
-
8
-
9
-
10
-
11
-
12
-
13
-
14
-
15
-
16
-
17
-
18
-
19
-
20
-
21
-
22
-
23
-
24
-
25
-
26
-
27
-
28
-
 29
29 -
 30
30 -
 31
31 -
 32
32 -
 33
33 -
 34
34 -
 35
35 -
 36
36 -
 37
37 -
 38
38 -
 39
39 -
 40
40 -
 41
41 -
 42
42 -
 43
43 -
 44
44 -
 45
45 -
 46
46 -
 47
47 -
 48
48 -
 49
49 -
50
-
51
-
52
-
53
-
54
-
55
-
56
-
57
-
58
-
59
-
60
-
61
-
62
-
63
-
64
-
65
-
66
-
67
-
68
-
69
-
70
-
71
-
72
-
73
-
74
-
75
-
76
-
77
-
78
-
79
-
80
-
81
-
82
-
83
-
84
-
85
-
86
-
87
-
88
-
89
-
90
-
91
-
92
-
93
-
94
-
95
-
96
 |
 |
29
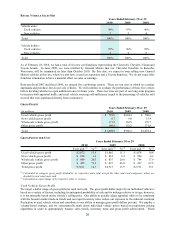
During fiscal 2009, the weakness in the economy and the stresses on consumer spending contributed to the industry-
wide slowdown in the sale of new and used vehicles and to the unprecedented decline in wholesale market prices for
most vehicle classes during the first three quarters of the year. These lower wholesale values reduced our vehicle
acquisition costs and contributed to the decline in our used and wholesale vehicle average selling price.
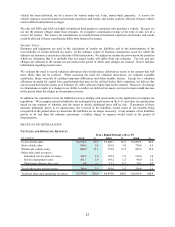
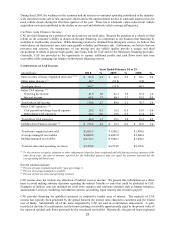
CarMax Auto Finance Income
CAF provides financing for a portion of our used and new car retail sales. Because the purchase of a vehicle is often
reliant on the consumer’s ability to obtain on-the-spot financing, it is important to our business that financing be
available to creditworthy customers. While financing can also be obtained from third-party sources, we believe that
total reliance on third parties can create unacceptable volatility and business risk. Furthermore, we believe that our
processes and systems, the transparency of our pricing and our vehicle quality provide a unique and ideal
environment in which to procure high quality auto loans, both for CAF and for the third-party financing providers.
Generally, CAF has provided us the opportunity to capture additional profits and cash flows from auto loan
receivables while managing our reliance on third-party financing sources.
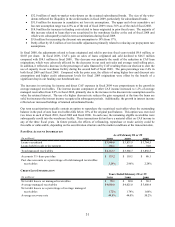
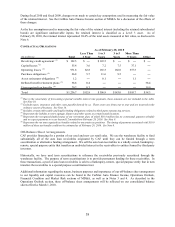
COMPONENTS OF CAF INCOME
(In millions) %%
Gain on sales of loans originated and sold
(1)(2)
83.0$ 4.5 46.5$ 2.4 58.1$ 2.4
Other gains (losses)
(1)
26.7 (81.8) (9.6)
Total gain (los s) 109.7 (35.3) 48.5
Other CAF income:
(3)
Servicing fee income 41.9 1.0 41.3 1.0 37.4 1.0
Interest income 68.5 1.7 48.3 1.2 33.3 0.9
Total other CAF income 110.4 2.7 89.6 2.2 70.7 2.0
Direct CAF expenses:
(3)
CAF payroll and fringe benefit expense 20.2 0.5 19.2 0.5 15.9 0.4
Other direct CAF expenses 24.7 0.6 19.9 0.5 17.4 0.5
Total direct CAF expenses 44.9 1.1 39.1 1.0 33.3 0.9
CarMax Auto Finance income
(4)
175.2$ 2.3 15.3$ 0.2 85.9$ 1.0
Total loans originated and s old 1,855.3$ 1,930.2$ 2,430.8$
Average managed receivables 4,080.0$ 4,021.0$ 3,608.4$
Ending managed receivables 4,112.7$ 3,986.7$ 3,838.5$
Total net sales and operating revenues 7,470.2$ 6,974.0$ 8,199.6$
Year s Ende d Fe bruar y 2 8 or 2 9
2010 2009 2008 %
(1) To the extent we recognize valuation or other adjustments related to loans originated and sold during previous quarters of the
same fiscal year, the sum of amounts reported for the individual quarters may not equal the amounts reported for the
corresponding full fiscal year.
Percent columns indicate:
(2) Percent of loans originated and sold (“gain percentage”).
(3) Percent of average managed receivables.
(4) Percent of total net sales and operating revenues.
CAF income does not include any allocation of indirect costs or income. We present this information on a direct
basis to avoid making arbitrary decisions regarding the indirect benefits or costs that could be attributed to CAF.
Examples of indirect costs not included are retail store expenses and corporate expenses such as human resources,
administrative services, marketing, information systems, accounting, legal, treasury and executive payroll.
CAF provides financing for qualified customers at competitive market rates of interest. The majority of CAF
income has typically been generated by the spread between the interest rates charged to customers and the related
cost of funds. Substantially all of the loans originated by CAF are sold in securitization transactions. A gain,
recorded at the time of securitization, results from recording a receivable approximately equal to the present value of
the expected residual cash flows generated by the securitized receivables. Historically, the gain on loans originated