CarMax 2010 Annual Report Download - page 53
Download and view the complete annual report
Please find page 53 of the 2010 CarMax annual report below. You can navigate through the pages in the report by either clicking on the pages listed below, or by using the keyword search tool below to find specific information within the annual report.-
 1
1 -
2
-
3
-
4
-
5
-
6
-
7
-
8
-
9
-
10
-
11
-
12
-
13
-
14
-
15
-
16
-
17
-
18
-
19
-
20
-
21
-
22
-
23
-
24
-
25
-
26
-
27
-
28
-
29
-
30
-
31
-
32
-
33
-
34
-
35
-
36
-
37
-
38
-
39
-
40
-
41
-
42
-
 43
43 -
 44
44 -
 45
45 -
 46
46 -
 47
47 -
 48
48 -
 49
49 -
 50
50 -
 51
51 -
 52
52 -
 53
53 -
 54
54 -
 55
55 -
 56
56 -
 57
57 -
 58
58 -
 59
59 -
 60
60 -
 61
61 -
 62
62 -
 63
63 -
64
-
65
-
66
-
67
-
68
-
69
-
70
-
71
-
72
-
73
-
74
-
75
-
76
-
77
-
78
-
79
-
80
-
81
-
82
-
83
-
84
-
85
-
86
-
87
-
88
-
89
-
90
-
91
-
92
-
93
-
94
-
95
-
96
 |
 |
43
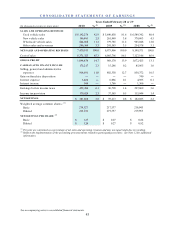
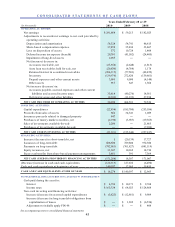
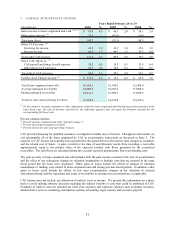
CONSOLIDATED STATEMENTS OF EARNINGS
(In thousands except per share data) 2010 %(1) 2009 %(1) 2008 %(1)
SALES AND O PERATING REVENUES:
Used vehicle s ales 6,192,278$ 82.9 5,690,658$ 81.6 6,589,342$ 80.4
New vehicle sales 186,481 2.5 261,940 3.8 370,603 4.5
W holesale vehicle sales 844,868 11.3 779,785 11.2 985,048 12.0
Other sales and revenues 246,566 3.3 241,583 3.5 254,578 3.1
NET SALES AND O PERATING REVENUES 7,470,193 100.0 6,973,966 100.0 8,199,571 100.0
Cos t of s ales 6,371,323 85.3 6,005,796 86.1 7,127,146 86.9
GROSS PROFIT 1,098,870 14.7 968,170 13.9 1,072,425 13.1
CARMAX AUTO FINANC E INC O ME 175,217 2.3 15,286 0.2 85,865 1.0
Selling, general and administrative
expenses 818,691 11.0 882,358 12.7 858,372 10.5
Gain on franchise disposition ― ― ― ― 740 ―
Interes t expens e 3,460 ― 6,086 0.1 4,955 0.1
Interes t income 560 ― 1,786 ― 1,366 ―
Earnings before income taxes 452,496 6.1 96,798 1.4 297,069 3.6
Income tax provision 170,828 2.3 37,585 0.5 115,044 1.4
NET EARNINGS 281,668$ 3.8 59,213$ 0.8 182,025$ 2.2
Weighted average common shares: (2)
Bas ic 219,527 217,537 216,045
Diluted 222,234 219,357 219,963
NET EARNINGS PER SHARE: (2)
Bas ic 1.27$ 0.27$ 0.84$
Diluted 1.26$ 0.27$ 0.82$
Ye ar s Ende d Fe bruar y 2 8 or 2 9
(1) Percents are calculated as a percentage of net sales and operating revenues and may not equal totals due to rounding.
(2) Reflects the implementation of the accounting pronouncement related to participating securities. See Note 12 for additional
information.
See accompanying notes to consolidated financial statements.