CarMax 2010 Annual Report Download - page 42
Download and view the complete annual report
Please find page 42 of the 2010 CarMax annual report below. You can navigate through the pages in the report by either clicking on the pages listed below, or by using the keyword search tool below to find specific information within the annual report.-
 1
1 -
2
-
3
-
4
-
5
-
6
-
7
-
8
-
9
-
10
-
11
-
12
-
13
-
14
-
15
-
16
-
17
-
18
-
19
-
20
-
21
-
22
-
23
-
24
-
25
-
26
-
27
-
28
-
29
-
30
-
31
-
 32
32 -
 33
33 -
 34
34 -
 35
35 -
 36
36 -
 37
37 -
 38
38 -
 39
39 -
 40
40 -
 41
41 -
 42
42 -
 43
43 -
 44
44 -
 45
45 -
 46
46 -
 47
47 -
 48
48 -
 49
49 -
 50
50 -
 51
51 -
 52
52 -
53
-
54
-
55
-
56
-
57
-
58
-
59
-
60
-
61
-
62
-
63
-
64
-
65
-
66
-
67
-
68
-
69
-
70
-
71
-
72
-
73
-
74
-
75
-
76
-
77
-
78
-
79
-
80
-
81
-
82
-
83
-
84
-
85
-
86
-
87
-
88
-
89
-
90
-
91
-
92
-
93
-
94
-
95
-
96
 |
 |
32
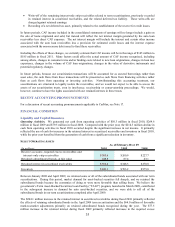
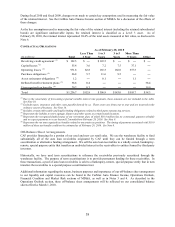
We are at risk for the performance of the managed securitized receivables to the extent of our retained interest in the
receivables. If the managed receivables do not perform in accordance with the assumptions used in determining the
fair value of the retained interest, earnings could be affected. Our retained interest was $552.4 million as of
February 28, 2010, compared with $348.3 million as of February 28, 2009.
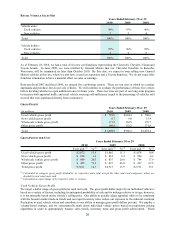
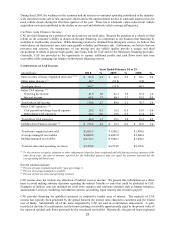
During fiscal 2010 and fiscal 2009, CAF’s net loss and delinquency performance was weaker than historical
averages. We believe this was primarily the result of the weak economic environment, which has adversely affected
unemployment and industry trends for losses and delinquencies. In response, we tightened CAF’s lending criteria in
February and June 2009. In November 2009, one of our third-party finance providers began purchasing a large
portion of the loans that CAF would have originated prior to the tightening of lending standards, offsetting the
majority of the adverse sales effect of the tightening.
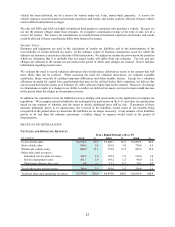
The average recovery rate represents the average percentage of the outstanding principal balance we receive when a
vehicle is repossessed and liquidated at wholesale auction. Historically, the annual recovery rate has ranged from a
low of 42% to a high of 51%, and it is primarily affected by changes in the wholesale market pricing environment.
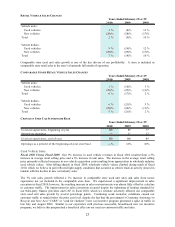
Selling, General and Administrative Expenses
SG&A expenses primarily include rent and occupancy costs; payroll expenses, other than payroll related to
reconditioning and vehicle repair service, which is included in cost of sales; fringe benefits; advertising; and other
general expenses.
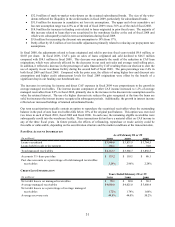
Fiscal 2010 Versus Fiscal 2009. SG&A expenses were reduced 7% to $818.7 million from $882.4 million in fiscal
2009, despite the increase in unit sales in fiscal 2010. Given the weak environment experienced in the last two
years, we felt it was prudent to take a particularly cautious approach to SG&A spending during fiscal 2010.
Accordingly, we made significant curtailments in advertising, implemented a wage freeze for all salaried and hourly
associates and a hiring freeze at our home office, reduced our management bench strength and deferred
developmental and discretionary project spending. The SG&A expense reduction also reflected decreases in
growth-related costs, including pre-opening and relocation costs, resulting from the suspension of store growth, as
well as benefits from a variety of waste-reduction initiatives. The SG&A ratio fell to 11.0% from 12.7% in fiscal
2009 primarily due to the reduction in SG&A expenses and the leverage associated with the increases in average
selling prices and unit sales.
The fiscal 2010 SG&A expenses included the benefit of a favorable litigation settlement, which increased net
earnings by $0.02 per share, while the fiscal 2009 SG&A expenses included various non-recurring items, which in
the aggregate reduced net earnings by a total of $0.04 per share.
Fiscal 2009 Versus Fiscal 2008. SG&A expenses increased 3% to $882.4 million from $858.4 million in fiscal
2008, although we increased our store base by 12% in fiscal 2009. In response to the decline in sales, we focused on
reducing store and corporate overhead costs, including payroll and advertising. Our total number of associates
declined to 13,035 as of the end of fiscal 2009 from a peak of approximately 16,400 in May 2008. The fiscal 2009
SG&A expenses also reflected reductions in growth-related costs resulting from the suspension of store growth. The
SG&A ratio increased to 12.7% from 10.5% in fiscal 2009 primarily due to the significant declines in comparable
store used unit sales and average selling price.
The fiscal 2009 SG&A expenses included a number of non-recurring items, which in the aggregate reduced net
earnings by $0.04 per share. These non-recurring items included severance costs associated with a reduction in our
service operations workforce in October 2008, costs for the termination of store site acquisitions resulting from our
decision to temporarily suspend store growth, and litigation costs, partially offset by a benefit related to our decision
to freeze our pension plan benefits as of December 31, 2008.
Income Taxes
The effective income tax rate was 37.8% in fiscal 2010, 38.8% in fiscal 2009 and 38.7% in fiscal 2008. The fiscal
2010 effective tax rate was slightly reduced by the favorable settlement of prior year tax audits.
OPERATIONS OUTLOOK
Based upon improvements in our sales and profitability in fiscal 2010 and the increasing stability in the credit
markets, we have decided to resume store growth in fiscal 2011. We plan to take a measured approach by opening
three superstores in fiscal 2011, between three and five superstores in fiscal 2012, and between five and ten