CarMax 2010 Annual Report Download - page 56
Download and view the complete annual report
Please find page 56 of the 2010 CarMax annual report below. You can navigate through the pages in the report by either clicking on the pages listed below, or by using the keyword search tool below to find specific information within the annual report.-
 1
1 -
2
-
3
-
4
-
5
-
6
-
7
-
8
-
9
-
10
-
11
-
12
-
13
-
14
-
15
-
16
-
17
-
18
-
19
-
20
-
21
-
22
-
23
-
24
-
25
-
26
-
27
-
28
-
29
-
30
-
31
-
32
-
33
-
34
-
35
-
36
-
37
-
38
-
39
-
40
-
41
-
42
-
43
-
44
-
45
-
 46
46 -
 47
47 -
 48
48 -
 49
49 -
 50
50 -
 51
51 -
 52
52 -
 53
53 -
 54
54 -
 55
55 -
 56
56 -
 57
57 -
 58
58 -
 59
59 -
 60
60 -
 61
61 -
 62
62 -
 63
63 -
 64
64 -
 65
65 -
 66
66 -
67
-
68
-
69
-
70
-
71
-
72
-
73
-
74
-
75
-
76
-
77
-
78
-
79
-
80
-
81
-
82
-
83
-
84
-
85
-
86
-
87
-
88
-
89
-
90
-
91
-
92
-
93
-
94
-
95
-
96
 |
 |

46
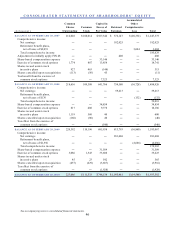
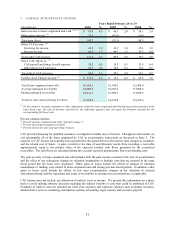
CONSOLIDATED STATEMENTS OF SHAREHOLDERS’ EQUITY
(In thousands)
BALANCE AS O F FEBRUARY 28, 2007 216,028 108,014$ 587,546$ 572,147$ (20,332)$ 1,247,375$
Comprehensive income:
Net earnings ― ― ― 182,025 ― 182,025
Retirement benefit plans,
net of taxes of $2,091 ― ― ― ― 3,604 3,604
To tal co mpreh en s ive income 185,629
A dju s tmen t to initially ap ply FIN 48 ― ― ― 408 ― 408
Share-based compensation expense ― ― 33,146 ― ― 33,146
Exercise of common stock options 1,774 887 13,854 ― ― 14,741
Shares issued under stock
incentive plans 927 463 (148) ― ― 315
Shares cancelled upon reacquisition (113) (56) 45 ― ― (11)
Tax benefit from the exercise of
common stock options ― ― 7,323 ― ― 7,323
BALANCE AS O F FEBRUARY 29, 2008 218,616 109,308 641,766 754,580 (16,728) 1,488,926
Comprehensive income:
Net earnings ― ― ― 59,213 ― 59,213
Retirement benefit plans,
net of taxes of $176 ― ― ― ― (132) (132)
To tal co mpreh en s ive income 59,081
Share-based compensation expense ― ― 34,854 ― ― 34,854
Exercise of common stock options 817 408 9,778 ― ― 10,186
Shares issued under stock
incentive plans 1,119 560 40 ― ― 600
Shares cancelled upon reacquisition (160) (80) 40 ― ― (40)
Tax effect from the exercise of
common stock options ― ― (540) ― ― (540)
BALANCE AS O F FEBRUARY 28, 2009 220,392 110,196 685,938 813,793 (16,860) 1,593,067
Comprehensive income:
Net earnings ― ― ― 281,668 ― 281,668
Retirement benefit plans,
net of taxes of $1,556 ― ― ― ― (2,686) (2,686)
To tal co mpreh en s ive income 278,982
Share-based compensation expense ― ― 31,589 ― ― 31,589
Exercise of common stock options 3,086 1,543 33,680 ― ― 35,223
Shares issued under stock
incentive plans 45 23 542 ― ― 565
Shares cancelled upon reacquisition (457) (229) (3,687) ― ― (3,916)
Tax effect from the exercise of
common stock options ― ― (1,928) ― ― (1,928)
BALANCE AS O F FEBRUARY 28, 2010 223,066 111,533$ 746,134$ 1,095,461$ (19,546)$ 1,933,582$
Accumulate d
Common
Shares
Capital in Other
Outstanding S tock
Common Excess of
Par Value TotalEarn i ngs
Retained Comprehensive
Loss
See accompanying notes to consolidated financial statements.