CarMax 2010 Annual Report Download - page 47
Download and view the complete annual report
Please find page 47 of the 2010 CarMax annual report below. You can navigate through the pages in the report by either clicking on the pages listed below, or by using the keyword search tool below to find specific information within the annual report.-
 1
1 -
2
-
3
-
4
-
5
-
6
-
7
-
8
-
9
-
10
-
11
-
12
-
13
-
14
-
15
-
16
-
17
-
18
-
19
-
20
-
21
-
22
-
23
-
24
-
25
-
26
-
27
-
28
-
29
-
30
-
31
-
32
-
33
-
34
-
35
-
36
-
 37
37 -
 38
38 -
 39
39 -
 40
40 -
 41
41 -
 42
42 -
 43
43 -
 44
44 -
 45
45 -
 46
46 -
 47
47 -
 48
48 -
 49
49 -
 50
50 -
 51
51 -
 52
52 -
 53
53 -
 54
54 -
 55
55 -
 56
56 -
 57
57 -
58
-
59
-
60
-
61
-
62
-
63
-
64
-
65
-
66
-
67
-
68
-
69
-
70
-
71
-
72
-
73
-
74
-
75
-
76
-
77
-
78
-
79
-
80
-
81
-
82
-
83
-
84
-
85
-
86
-
87
-
88
-
89
-
90
-
91
-
92
-
93
-
94
-
95
-
96
 |
 |

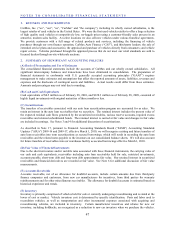
37
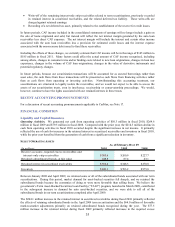
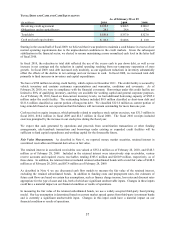
TOTAL DEBT AND CASH AND CASH EQUIVALENTS
(In millions)
2010 2009 2008
Revolving credit agreement 122.5$ 308.5$ 300.2$
Obligations under capital leases 28.1 28.6 27.6
Total debt 150.6$ 337.0$ 327.8$
Cash and cash equivalents 18.3$ 140.6$ 13.0$
As of February 28 or 29
Starting in the second half of fiscal 2009, we believed that it was prudent to maintain a cash balance in excess of our
normal operating requirements due to the unprecedented conditions in the credit markets. Given the subsequent
stabilization in the financial sector, we elected to resume maintaining a more normalized cash level in the latter half
of fiscal 2010.
In fiscal 2010, the reduction in total debt reflected the use of the excess cash to pay down debt, as well as our
increase in net earnings and the reduction in capital spending resulting from our temporary suspension of store
growth. In fiscal 2009, total debt increased only modestly, as our significant reductions in inventory substantially
offset the effects of the decline in net earnings and our increase in cash. In fiscal 2008, we increased total debt
primarily to fund increases in inventory and capital expenditures.
We have a $700 million revolving credit facility, which expires in December 2011. The credit facility is secured by
vehicle inventory and contains customary representations and warranties, conditions and covenants. As of
February 28, 2010, we were in compliance with the financial covenants. Borrowings under this credit facility are
limited to 80% of qualifying inventory, and they are available for working capital and general corporate purposes.
As of February 28, 2010, based on then-current inventory levels, we had additional borrowing capacity of $505.4
million under the credit facility. The outstanding balance included $0.9 million classified as short-term debt and
$121.6 million classified as current portion of long-term debt. We classified $121.6 million as current portion of
long-term debt based on our expectation that this balance will not remain outstanding for more than one year.
Cash received on equity issuances, which primarily related to employee stock option exercises, was $31.3 million in
fiscal 2010, $10.2 million in fiscal 2009 and $14.7 million in fiscal 2008. The fiscal 2010 receipts included
exercises prompted by the increase in our stock price during the fiscal year.
We expect that cash generated by operations and proceeds from securitization transactions or other funding
arrangements, sale-leaseback transactions and borrowings under existing or expanded credit facilities will be
sufficient to fund capital expenditures and working capital for the foreseeable future.
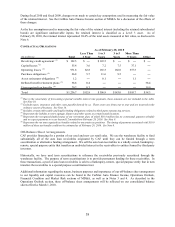
Fair Value Measurements. As described in Note 6, we reported money market securities, retained interest in
securitized receivables and financial derivatives at fair value.
The retained interest in securitized receivables was valued at $552.4 million as of February 28, 2010, and $348.3
million as of February 28, 2009. Included in the retained interest were interest-only strip receivables, various
reserve accounts and required excess receivables totaling $303.6 million and $260.9 million, respectively, as of
these dates. In addition, the retained interest included retained subordinated bonds with a total fair value of $248.8
million as of February 28, 2010, and $87.4 million as of February 28, 2009.
As described in Note 4, we use discounted cash flow models to measure the fair value of the retained interest,
excluding the retained subordinated bonds. In addition to funding costs and prepayment rates, the estimates of
future cash flows are based on certain key assumptions, such as finance charge income, loss rates and discount rates
appropriate for the type of asset and risk, both of which are significant unobservable inputs. Changes in these inputs
could have a material impact on our financial condition or results of operations.
In measuring the fair value of the retained subordinated bonds, we use a widely accepted third-party bond pricing
model. Our key assumption is determined based on current market spread quotes from third-party investment banks
and is currently a significant unobservable input. Changes in this input could have a material impact on our
financial condition or results of operations.