CarMax 2010 Annual Report Download - page 64
Download and view the complete annual report
Please find page 64 of the 2010 CarMax annual report below. You can navigate through the pages in the report by either clicking on the pages listed below, or by using the keyword search tool below to find specific information within the annual report.-
 1
1 -
2
-
3
-
4
-
5
-
6
-
7
-
8
-
9
-
10
-
11
-
12
-
13
-
14
-
15
-
16
-
17
-
18
-
19
-
20
-
21
-
22
-
23
-
24
-
25
-
26
-
27
-
28
-
29
-
30
-
31
-
32
-
33
-
34
-
35
-
36
-
37
-
38
-
39
-
40
-
41
-
42
-
43
-
44
-
45
-
46
-
47
-
48
-
49
-
50
-
51
-
52
-
53
-
 54
54 -
 55
55 -
 56
56 -
 57
57 -
 58
58 -
 59
59 -
 60
60 -
 61
61 -
 62
62 -
 63
63 -
 64
64 -
 65
65 -
 66
66 -
 67
67 -
 68
68 -
 69
69 -
 70
70 -
 71
71 -
 72
72 -
 73
73 -
 74
74 -
75
-
76
-
77
-
78
-
79
-
80
-
81
-
82
-
83
-
84
-
85
-
86
-
87
-
88
-
89
-
90
-
91
-
92
-
93
-
94
-
95
-
96
 |
 |

54
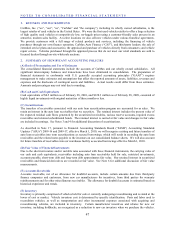
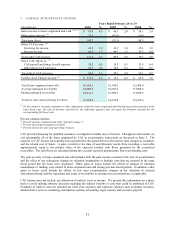
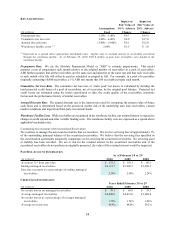
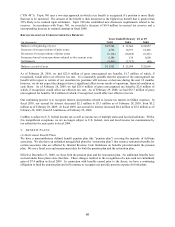
KEY ASSUMPTIONS
(In m illions)
Prepayment rate 1.20% - 1.40% 9.7$ 19.5$
Cumulative net los s rate 2.00% - 4.00% 8.9$ 17.8$
Annual discount rate 15.00% - 19.00% 6.1$ 12.0$
Warehouse facility costs (1) 2.68% 1.5$ 3.0$
Assumptions
Us e d
Impac t on
Fair Value of
10% Adverse
Change
Impac t on
Fair Value of
20% Adverse
Change
(1) Expressed as a spread above appropriate benchmark rates. Applies only to retained interest in receivables securitized
through the warehouse facility. As of February 28, 2010, $331.0 million of auto loan receivables were funded in the
warehouse facility.
Prepayment Rate. We use the Absolute Prepayment Model or “ABS” to estimate prepayments. This model
assumes a rate of prepayment each month relative to the original number of receivables in a pool of receivables.
ABS further assumes that all the receivables are the same size and amortize at the same rate and that each receivable
in each month of its life will either be paid as scheduled or prepaid in full. For example, in a pool of receivables
originally containing 10,000 receivables, a 1% ABS rate means that 100 receivables prepay each month.
Cumulative Net Loss Rate. The cumulative net loss rate, or “static pool” net losses, is calculated by dividing the
total projected credit losses of a pool of receivables, net of recoveries, by the original pool balance. Projected net
credit losses are estimated using the losses experienced to date, the credit quality of the receivables, economic
factors and the performance history of similar receivables.
Annual Discount Rate. The annual discount rate is the interest rate used for computing the present value of future
cash flows and is determined based on the perceived market risk of the underlying auto loan receivables, current
market conditions and input from third-party investment banks.
Warehouse Facility Costs. While receivables are securitized in the warehouse facility, our retained interest is exposed to
changes in credit spreads and other variable funding costs. The warehouse facility costs are expressed as a spread above
applicable benchmark rates.
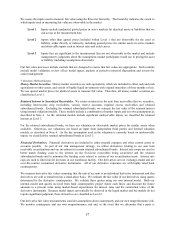
Continuing Involvement with Securitized Receivables
We continue to manage the auto loan receivables that we securitize. We receive servicing fees of approximately 1%
of the outstanding principal balance of the securitized receivables. We believe that the servicing fees specified in
the securitization agreements adequately compensate us for servicing the securitized receivables. No servicing asset
or liability has been recorded. We are at risk for the retained interest in the securitized receivables and, if the
securitized receivables do not perform as originally projected, the value of the retained interest would be impacted.
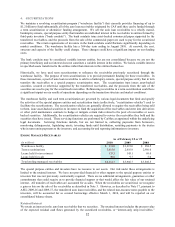
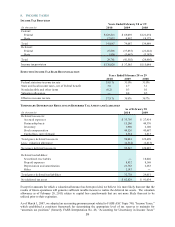
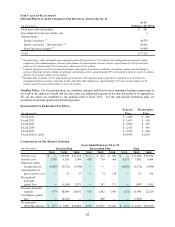
PAST DUE ACCOUNT INFORMATION
(In m illions)
Accounts 31+ days past due 133.2$ 118.1$ 86.1$
Ending managed receivables 4,112.7$ 3,986.7$ 3,838.5$
Past due accounts as a percentage of ending managed
receivables 3.24% 2.96% 2.24%
As of February 28 or 29
2010 2009 2008
CREDIT LOSS INFORMATION
(In m illions)
Net credit losses on managed receivables 70.1$ 69.8$ 38.3$
Average managed receivables 4,080.0$ 4,021.0$ 3,608.4$
Net credit losses as a percentage of average managed
receivables 1.72% 1.74% 1.06%
Average recovery rate 49.8% 44.0% 50.2%
Ye ar s Ende d Fe bruar y 2 8 or 2 9
2010 2009 2008