CarMax 2010 Annual Report Download - page 55
Download and view the complete annual report
Please find page 55 of the 2010 CarMax annual report below. You can navigate through the pages in the report by either clicking on the pages listed below, or by using the keyword search tool below to find specific information within the annual report.-
 1
1 -
2
-
3
-
4
-
5
-
6
-
7
-
8
-
9
-
10
-
11
-
12
-
13
-
14
-
15
-
16
-
17
-
18
-
19
-
20
-
21
-
22
-
23
-
24
-
25
-
26
-
27
-
28
-
29
-
30
-
31
-
32
-
33
-
34
-
35
-
36
-
37
-
38
-
39
-
40
-
41
-
42
-
43
-
44
-
 45
45 -
 46
46 -
 47
47 -
 48
48 -
 49
49 -
 50
50 -
 51
51 -
 52
52 -
 53
53 -
 54
54 -
 55
55 -
 56
56 -
 57
57 -
 58
58 -
 59
59 -
 60
60 -
 61
61 -
 62
62 -
 63
63 -
 64
64 -
 65
65 -
66
-
67
-
68
-
69
-
70
-
71
-
72
-
73
-
74
-
75
-
76
-
77
-
78
-
79
-
80
-
81
-
82
-
83
-
84
-
85
-
86
-
87
-
88
-
89
-
90
-
91
-
92
-
93
-
94
-
95
-
96
 |
 |

45
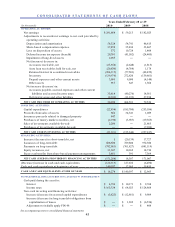
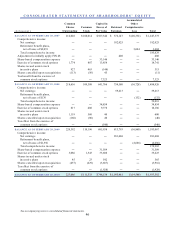
CONSOLIDATED STATEMENTS OF CASH FLOWS
(In thousands)
O PERATING ACTIVITIES:
Net earnings 281,668$ 59,213$ 182,025$
Adjustments to reconcile net earnings to net cash provided by
operating activities:
Depreciation and amortization 58,328 54,741 46,615
Share-based compensation expense 37,858 35,436 33,467
Loss on disposition of assets 372 10,728 1,404
Deferred income tax expense (benefit) 29,761 (41,502) (24,405)
Impairment of long-lived assets 2,055 ― ―
Net (increase) decrease in:
Accounts receivable, net (23,558) (2,648) (1,815)
Auto loan receivables held for sale, net (20,830) (4,764) 1,178
Retained interest in securitized receivables (204,115) (77,501) (68,459)
Inventory (139,976) 272,620 (139,661)
Prepaid expenses and other current assets 3,095 9,090 (4,148)
Other assets 917 647 1,360
Net increase (decrease) in:
Accounts payable, accrued expenses and other current
liabilities and accru ed inco me taxes 33,818 (40,276) 14,561
Deferred revenue and other liabilities (9,103) (11,193) 37,398
N ET C A S H P R O V ID ED B Y O P ER A TI N G A C TIV ITIES 50,290 264,591 79,520
INVESTING AC TIVITIES:
Capital expenditures (22,434) (185,700) (253,106)
Proceeds from sales of assets 662 34,341 1,089
Insurance proceeds related to damaged property 447 ― ―
Purchases of money market securities, net (2,196) (3,987) (19,565)
Sales of investments available-for-sale 2,200 ― 21,665
Purchases of investments available-for-sale ― ― (7,100)
N ET C A S H U S ED IN IN V ES TIN G A C TIV ITIES (21,321) (155,346) (257,017)
FINANC ING ACTIVITIES:
Increase (decrease) in short-term debt, net 5 (20,139) 17,727
Issuances of long-term debt 606,500 789,800 972,300
Payments on long-term debt (792,981) (761,827) (841,119)
Equity issuances, net 31,307 10,162 14,730
Excess tax benefits from share-based payment arrangements 3,881 391 7,369
NET CASH (USED IN) PRO VIDED BY FINANC ING ACTIVITIES (151,288) 18,387 171,007
(Decrease) increase in cash and cash equivalents (122,319) 127,632 (6,490)
Cash and cash equivalents at beginning of year 140,597 12,965 19,455
CASH AND C ASH EQ UIVALENTS AT END O F YEAR 18,278$ 140,597$ 12,965$
SUPPLEMENTAL DISCLOSURES OF CASH FLOW INFORMATION
Cash paid during the year for:
Interes t 4,796$ 10,171$ 9,768$
Income taxes 163,324$ 64,023$ 124,868$
Non-cash investing and financing activities:
Increase (decrease) in accrued capital expenditures (5,823)$ (12,861)$ 9,909$
Increase (decrease) in long-term debt obligations from
capitalization of leases ―$ 1,382$ (6,554)$
Adjustment to initially apply FIN 48 ―$ ―$ 408$
Ye ar s Ende d Fe bruar y 2 8 or 2 9
2010 2009 2008
See accompanying notes to consolidated financial statements.