CarMax 2010 Annual Report Download - page 72
Download and view the complete annual report
Please find page 72 of the 2010 CarMax annual report below. You can navigate through the pages in the report by either clicking on the pages listed below, or by using the keyword search tool below to find specific information within the annual report.-
 1
1 -
2
-
3
-
4
-
5
-
6
-
7
-
8
-
9
-
10
-
11
-
12
-
13
-
14
-
15
-
16
-
17
-
18
-
19
-
20
-
21
-
22
-
23
-
24
-
25
-
26
-
27
-
28
-
29
-
30
-
31
-
32
-
33
-
34
-
35
-
36
-
37
-
38
-
39
-
40
-
41
-
42
-
43
-
44
-
45
-
46
-
47
-
48
-
49
-
50
-
51
-
52
-
53
-
54
-
55
-
56
-
57
-
58
-
59
-
60
-
61
-
 62
62 -
 63
63 -
 64
64 -
 65
65 -
 66
66 -
 67
67 -
 68
68 -
 69
69 -
 70
70 -
 71
71 -
 72
72 -
 73
73 -
 74
74 -
 75
75 -
 76
76 -
 77
77 -
 78
78 -
 79
79 -
 80
80 -
 81
81 -
 82
82 -
83
-
84
-
85
-
86
-
87
-
88
-
89
-
90
-
91
-
92
-
93
-
94
-
95
-
96
 |
 |

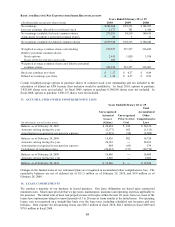
62
FAIR VALUE OF PLAN ASSETS
QUOTED PRICES IN ACTIVE MARKETS FOR IDENTICAL ASSETS (LEVEL 1)
(In thousands)
Cash and cash equivalents 861$
Investment income receivables, net 3
Mutual funds:
Equity securities (1) 46,539
Equity securities – international (2) 10,882
Fixed income securities (3) 19,438
Total 77,723$
February 28, 2010
As of
(1) Includes large-, mid- and small-cap companies primarily from diverse U.S. industries including pharmaceuticals, banks,
computers, telecommunications, internet and commercial and business services sectors; approximately 85% of securities
relate to U.S. entities and 15% of securities relate to non-U.S. entities.
(2) Consists of equity securities of primarily foreign corporations from diverse industries including commercial and business
services, financial services, banks, oil and gas, and mining sectors; approximately 95% of securities relate to non-U.S. entities
and 5% of securities relate to U.S. entities.
(3) Includes debt securities of U.S. and foreign governments, their agencies and corporations, and diverse investments in
mortgage-backed securities, corporate bonds, and other debt obligations; approximately 75% of securities relate to U.S.
entities and 25% of securities relate to non-U.S. entities.
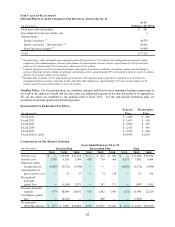
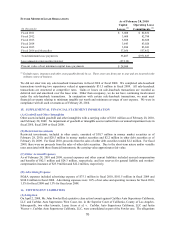
Funding Policy. For the pension plan, we contribute amounts sufficient to meet minimum funding requirements as
set forth in the employee benefit and tax laws, plus any additional amounts as we may determine to be appropriate.
We do not expect to contribute to the pension plan in fiscal 2011. For the non-funded restoration plan, we
contribute an amount equal to the benefit payments.
ESTIMATED FUTURE BENEFIT PAYMENTS
(In thousands)
1,400$ 406$
1,693$ 436$
2,030$ 450$
2,362$ 456$
2,708$ 464$
19,439$ 2,556$
Fiscal 2011
Fiscal 2012
Fiscal 2014
Fiscal 2015
Fiscal 2013
Fiscal 2016 to 2020
Pension Restoration
Plan Plan
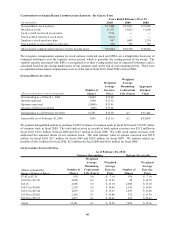
COMPONENTS OF NET PENSION EXPENSE
(In thousands)
2010 2009 2008 2010 2009 2008 2010 2009 2008
Service cost ―$ 10,548$ 15,670$ ―$ 832$ 688$ ―$ 11,380$ 16,358$
Interes t cos t 5,710 6,343 5,996 605 739 468 6,315 7,082 6,464
Expected return
on plan ass ets (6,487) (5,572) (3,994) ― ― ― (6,487) (5,572) (3,994)
Amortization of
prior service cost ― 23 37 ― 74 119 ― 97 156
Recognized
actuarial
(gain) loss ― (1,244) 2,973 ― 247 172 ― (997) 3,145
Pension (benefit)
expens e (777) 10,098 20,682 605 1,892 1,447 (172) 11,990 22,129
Curtailment (gain)
los s ― (8,229) ― ― 800 ― ― (7,429) ―
Net pension
(benefit) expens e (777)$ 1,869$ 20,682$ 605$ 2,692$ 1,447$ (172)$ 4,561$ 22,129$
Ye ar s Ende d Fe bruar y 2 8 or 2 9
Pension Plan Res toration Plan Total