CarMax 2010 Annual Report Download - page 48
Download and view the complete annual report
Please find page 48 of the 2010 CarMax annual report below. You can navigate through the pages in the report by either clicking on the pages listed below, or by using the keyword search tool below to find specific information within the annual report.-
 1
1 -
2
-
3
-
4
-
5
-
6
-
7
-
8
-
9
-
10
-
11
-
12
-
13
-
14
-
15
-
16
-
17
-
18
-
19
-
20
-
21
-
22
-
23
-
24
-
25
-
26
-
27
-
28
-
29
-
30
-
31
-
32
-
33
-
34
-
35
-
36
-
37
-
 38
38 -
 39
39 -
 40
40 -
 41
41 -
 42
42 -
 43
43 -
 44
44 -
 45
45 -
 46
46 -
 47
47 -
 48
48 -
 49
49 -
 50
50 -
 51
51 -
 52
52 -
 53
53 -
 54
54 -
 55
55 -
 56
56 -
 57
57 -
 58
58 -
59
-
60
-
61
-
62
-
63
-
64
-
65
-
66
-
67
-
68
-
69
-
70
-
71
-
72
-
73
-
74
-
75
-
76
-
77
-
78
-
79
-
80
-
81
-
82
-
83
-
84
-
85
-
86
-
87
-
88
-
89
-
90
-
91
-
92
-
93
-
94
-
95
-
96
 |
 |

38
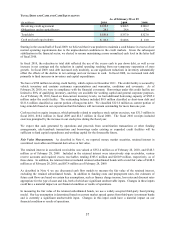
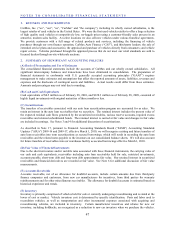
During fiscal 2010 and fiscal 2009, changes were made to certain key assumptions used in measuring the fair value
of the retained interest. See the CarMax Auto Finance Income section of MD&A for a discussion of the effects of
these changes.
As the key assumptions used in measuring the fair value of the retained interest (including the retained subordinated
bonds) are significant unobservable inputs, the retained interest is classified as a Level 3 asset. As of
February 28, 2010, the retained interest represented 94.4% of the total assets measured at fair value, as disclosed in
Note 6.
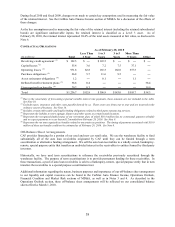
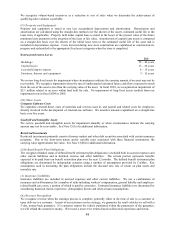
CONTRACTUAL OBLIGATIONS
(In millions)
Revolving credit agreement
(1)
122.5$ ―$ 122.5$ ―$ ―$ ―$
Capital leases
(2)
55.4 3.6 7.2 7.5 37.1 ―
Operating leases
(2)
971.8 82.8 165.5 166.0 557.5 ―
Purchase obligations
(3)
26.8 5.7 11.6 9.5 ― ―
Asset retirement obligations
(4)
1.2 ― 0.1 ― 1.1 ―
Defined benefit retirement plans
(5)
38.8 0.4 ― ― ― 38.4
Unrecognized tax benefits
(6)
20.2 0.3 ― ― ― 19.9
Total 1,236.7$ 92.8$ 306.9$ 183.0$ 595.7$ 58.3$
Total OtherYe ar s Year s 5 Ye ar s
As of February 28, 2010
Mor e Than3 to 51 to 3
1 Year
Les s Than
(1) Due to the uncertainty of forecasting expected variable interest rate payments, those amounts are not included in the table.
See Note 10.
(2) Excludes taxes, insurance and other costs payable directly by us. These costs vary from year to year and are incurred in the
ordinary course of business. See Note 14.
(3) Includes certain enforceable and legally binding obligations related to third-party outsourcing services.
(4) Represents the liability to retire signage, fixtures and other assets at certain leased locations.
(5) Represents the recognized funded status of our retirement plan, of which $38.4 million has no contractual payment schedule
and we expect payments to occur beyond 12 months from February 28, 2010. See Note 9.
(6) Represents the net unrecognized tax benefits related to uncertain tax positions. The timing of payments associated with $19.9
million of these tax benefits could not be estimated as of February 28, 2010. See Note 8.
Off-Balance Sheet Arrangements
CAF provides financing for a portion of our used and new car retail sales. We use the warehouse facility to fund
substantially all of the auto loan receivables originated by CAF until they can be funded through a term
securitization or alternative funding arrangement. We sell the auto loan receivables to a wholly owned, bankruptcy-
remote, special purpose entity that transfers an undivided interest in the receivables to entities formed by third-party
investors.
Historically, we have used term securitizations to refinance the receivables previously securitized through the
warehouse facility. The purpose of term securitizations is to provide permanent funding for these receivables. In
these transactions, a pool of auto loan receivables is sold to a bankruptcy-remote, special purpose entity that in turn
transfers the receivables to a special purpose securitization trust.
Additional information regarding the nature, business purposes and importance of our off-balance sheet arrangement
to our liquidity and capital resources can be found in the CarMax Auto Finance Income, Operations Outlook,
Financial Condition and Market Risk sections of MD&A, as well as in Notes 3 and 4. As described in the
Operations Outlook section, these off-balance sheet arrangements will be reflected on our consolidated balance
sheets effective March 1, 2010.