CarMax 2010 Annual Report Download - page 46
Download and view the complete annual report
Please find page 46 of the 2010 CarMax annual report below. You can navigate through the pages in the report by either clicking on the pages listed below, or by using the keyword search tool below to find specific information within the annual report.-
 1
1 -
2
-
3
-
4
-
5
-
6
-
7
-
8
-
9
-
10
-
11
-
12
-
13
-
14
-
15
-
16
-
17
-
18
-
19
-
20
-
21
-
22
-
23
-
24
-
25
-
26
-
27
-
28
-
29
-
30
-
31
-
32
-
33
-
34
-
35
-
 36
36 -
 37
37 -
 38
38 -
 39
39 -
 40
40 -
 41
41 -
 42
42 -
 43
43 -
 44
44 -
 45
45 -
 46
46 -
 47
47 -
 48
48 -
 49
49 -
 50
50 -
 51
51 -
 52
52 -
 53
53 -
 54
54 -
 55
55 -
 56
56 -
57
-
58
-
59
-
60
-
61
-
62
-
63
-
64
-
65
-
66
-
67
-
68
-
69
-
70
-
71
-
72
-
73
-
74
-
75
-
76
-
77
-
78
-
79
-
80
-
81
-
82
-
83
-
84
-
85
-
86
-
87
-
88
-
89
-
90
-
91
-
92
-
93
-
94
-
95
-
96
 |
 |
36
receivables and the effects of retaining subordinated bonds in the May and July 2008 term securitizations, partially
offset by a decrease in interest-only strip receivables and the $32.0 million of mark-to-market write-downs on
retained subordinated bonds recognized during fiscal 2009.
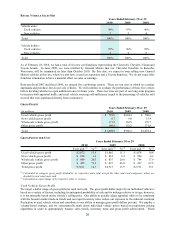
The $140.0 million increase in inventory during fiscal 2010 reflected the increase in our vehicle acquisition costs
caused by appreciation in wholesale vehicle values, combined with a 10% increase in used vehicle units in
inventory. The increase in units reflected the additional vehicles required to support recent sales trends. The $272.6
million reduction in inventory during fiscal 2009 primarily resulted from a 23% reduction in used vehicle units in
inventory, as well as a decline in vehicle acquisition costs for several vehicle categories, including SUVs and trucks.
The reduction in used vehicle inventory units occurred despite the 12% increase in our store base in fiscal 2009. We
dramatically reduced total used vehicle inventory units in response to falling customer demand and sales levels
during fiscal 2009.
The aggregate principal amount of outstanding auto loan receivables funded through securitizations, which are
discussed in Notes 3 and 4, totaled $3.95 billion as of February 28, 2010; $3.83 billion as of February 28, 2009; and
$3.76 billion as of February 29, 2008. During fiscal 2010, we completed four term securitizations, funding a total of
$2.57 billion of auto loan receivables. We retained subordinated bonds in conjunction with one of these term
securitizations. These bonds were issued at a discount and they had a fair value of $123.0 million as of
February 28, 2010. During fiscal 2009, we completed two term securitizations, funding a total of $1.28 billion of
auto loan receivables. We retained subordinated bonds in conjunction with both of these transactions. These bonds
had a fair value of $78.0 million as of February 28, 2010.
As of February 28, 2010, the warehouse facility limit was $1.2 billion. At that date, $331.0 million of auto loan
receivables were funded in the warehouse facility and unused warehouse capacity totaled $869.0 million. In
August 2009, we renewed the warehouse facility, which has a 364-day term. The size of the warehouse facility was
reduced from the previous $1.4 billion, as our then-current warehouse needs were lower than they were previously,
when economic conditions and our sales were stronger. Over the long term, we anticipate that we will be able to
enter into new, or renew or expand existing funding arrangements to meet CAF’s future funding needs. However,
based on conditions in the credit markets, the cost for these arrangements could be significantly higher than
historical levels and the timing and capacity of these transactions could be dictated by market availability rather than
our requirements. The securitization agreement related to the warehouse facility includes various financial
covenants. As of February 28, 2010, we were in compliance with the financial covenants. Note 4 includes
additional discussion of the warehouse facility.
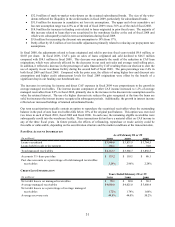
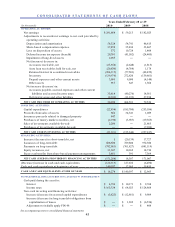
Investing Activities. Net cash used in investing activities was $21.3 million in fiscal 2010, $155.3 million in fiscal
2009 and $257.0 million in fiscal 2008. Capital expenditures totaled $22.4 million in fiscal 2010, $185.7 million in
fiscal 2009 and $253.1 million in fiscal 2008. The declines in capital spending in fiscal 2010 and fiscal 2009
reflected our decision in December 2008 to temporarily suspend store growth. In fiscal 2010, our capital spending
primarily represented maintenance capital, which is fairly modest because of the relatively young average age of our
store base. During fiscal 2009, we opened 11 used car superstores and we completed construction of 3 additional
stores that are now planned to be opened in fiscal 2011. During fiscal 2008, we opened 12 used car superstores. In
addition to store construction costs, capital expenditures for fiscal 2009 and fiscal 2008 included the cost of land
acquired for future year store openings.
Historically, capital expenditures have been funded with internally generated funds, long-term debt and sale-
leaseback transactions. Net proceeds from the sales of assets totaled $0.7 million in fiscal 2010, $34.3 million in
fiscal 2009 and $1.1 million in fiscal 2008. During fiscal 2009, we completed sale-leaseback transactions for our
two used car superstores in Austin, Texas, valued at $31.3 million.
As of February 28, 2010, we owned 41 used car superstores currently in operation, 3 superstores that were
constructed in fiscal 2009 prior to our suspension of store growth and that we plan to open in the first half of fiscal
2011 and our home office in Richmond, Virginia. In addition, five superstores were accounted for as capital leases.
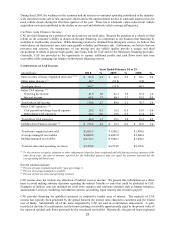
Financing Activities. During fiscal 2010, net cash used in financing activities totaled $151.3 million, including a
reduction in total debt of $186.5 million. During fiscal 2009 and fiscal 2008, net cash provided by financing
activities totaled $18.4 million and $171.0 million, respectively, including increases in total debt of $7.8 million and
$148.9 million, respectively. The increase in total debt for fiscal 2009 was net of a $1.4 million non-cash increase in
long-term debt related to capital leases. The increase in total debt for fiscal 2008 was net of a $6.6 million non-cash
decrease in long-term debt related to capital leases.