CarMax 2010 Annual Report Download - page 41
Download and view the complete annual report
Please find page 41 of the 2010 CarMax annual report below. You can navigate through the pages in the report by either clicking on the pages listed below, or by using the keyword search tool below to find specific information within the annual report.-
 1
1 -
2
-
3
-
4
-
5
-
6
-
7
-
8
-
9
-
10
-
11
-
12
-
13
-
14
-
15
-
16
-
17
-
18
-
19
-
20
-
21
-
22
-
23
-
24
-
25
-
26
-
27
-
28
-
29
-
30
-
 31
31 -
 32
32 -
 33
33 -
 34
34 -
 35
35 -
 36
36 -
 37
37 -
 38
38 -
 39
39 -
 40
40 -
 41
41 -
 42
42 -
 43
43 -
 44
44 -
 45
45 -
 46
46 -
 47
47 -
 48
48 -
 49
49 -
 50
50 -
 51
51 -
52
-
53
-
54
-
55
-
56
-
57
-
58
-
59
-
60
-
61
-
62
-
63
-
64
-
65
-
66
-
67
-
68
-
69
-
70
-
71
-
72
-
73
-
74
-
75
-
76
-
77
-
78
-
79
-
80
-
81
-
82
-
83
-
84
-
85
-
86
-
87
-
88
-
89
-
90
-
91
-
92
-
93
-
94
-
95
-
96
 |
 |

31
• $32.0 million of mark-to-market write-downs on the retained subordinated bonds. The size of the write-
downs reflected the illiquidity in the credit markets in fiscal 2009, particularly for subordinated bonds.
• $31.8 million for increases in cumulative net loss rate assumptions. The upper end of our cumulative net
loss rate assumption range was 4.0% as of the end of fiscal 2009 versus 3.0% as of the end of fiscal 2008.
• $18.0 million for increases in funding costs related to loans originated in prior fiscal years. The majority of
this increase related to loans that were securitized in the warehouse facility at the end of fiscal 2008 and
which were subsequently resold in term securitizations during fiscal 2009.
• $3.8 million for increasing the discount rate assumption to 19% from 17%.
• Partly offset by $3.8 million of net favorable adjustments primarily related to reducing our prepayment rate
assumptions.
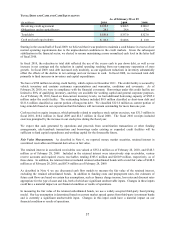
In fiscal 2008, the adjustments related to loans originated and sold in previous fiscal years totaled $9.6 million, or
$0.03 per share. In fiscal 2009, CAF’s gain on sales of loans originated and sold declined to $46.5 million
compared with $58.1 million in fiscal 2008. This decrease was primarily the result of the reduction in CAF loan
originations, which were adversely affected by the decreases in our used unit sales and average retail selling price.
In addition, it reflected a decrease in the percentage of sales financed by CAF resulting from our election to slow the
use of capacity in our warehouse facility during the second half of fiscal 2009. The gain percentage was 2.4% in
both fiscal 2009 and fiscal 2008. Compared with the prior year, the effects of using higher loss and discount rate
assumptions and higher credit enhancement levels for fiscal 2009 originations were offset by the benefit of a
significant drop in our funding cost benchmark rate.
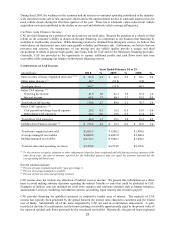
The increases in servicing fee income and direct CAF expenses in fiscal 2009 were proportionate to the growth in
average managed receivables. The interest income component of other CAF income increased to 1.2% of average
managed receivables from 0.9% in fiscal 2008, primarily due to the increase in the discount rate assumption used to
value the retained interest. The use of a higher discount rate reduces the gain recognized at the time the loans are
sold, but increases the interest income recognized in subsequent periods. Additionally, the growth in interest income
reflected our increased holdings of retained subordinated bonds.
Our term securitizations typically contain an option to repurchase the securitized receivables when the outstanding
balance in the pool of auto loan receivables falls below 10% of the original pool balance. This option was exercised
two times in each of fiscal 2010, fiscal 2009 and fiscal 2008. In each case, the remaining eligible receivables were
subsequently resold into the warehouse facility. These transactions did not have a material effect on CAF income in
any of the three fiscal years. In future periods, the effects of refinancing, repurchase or resale activity could be
favorable or unfavorable, depending on the securitization structure and the market conditions at the transaction date.
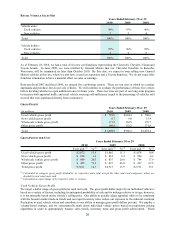
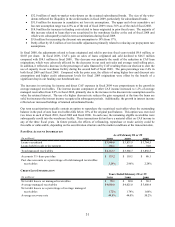
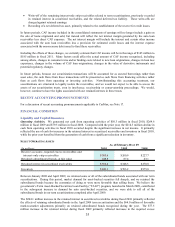
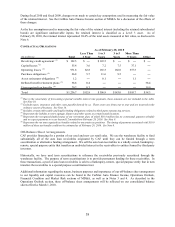
PAST DUE ACCOUNT INFORMATION
(In millions)
Loans s ecuritized 3,946.6$ 3,831.9$ 3,764.5$
Loans held for s ale or inves tment 166.1 154.8 74.0
Total managed receivables 4,112.7$ 3,986.7$ 3,838.5$
Accounts 31+ days past due 133.2$ 118.1$ 86.1$
Past due accounts as a percentage of total managed receivables
receivables 3.24% 2.96% 2.24%
As of February 28 or 29
2010 2009 2008
CREDIT LOSS INFORMATION
(In millions)
Net credit losses on managed receivables 70.1$ 69.8$ 38.3$
Average managed receivables 4,080.0$ 4,021.0$ 3,608.4$
Net credit losses as a percentage of average managed
receivables 1.72% 1.74% 1.06%
Average recovery rate 49.8% 44.0% 50.2%
2010 2009 2008
Year s Ende d Fe bruar y 2 8 or 2 9