CarMax 2010 Annual Report Download - page 30
Download and view the complete annual report
Please find page 30 of the 2010 CarMax annual report below. You can navigate through the pages in the report by either clicking on the pages listed below, or by using the keyword search tool below to find specific information within the annual report.-
 1
1 -
2
-
3
-
4
-
5
-
6
-
7
-
8
-
9
-
10
-
11
-
12
-
13
-
14
-
15
-
16
-
17
-
18
-
19
-
 20
20 -
 21
21 -
 22
22 -
 23
23 -
 24
24 -
 25
25 -
 26
26 -
 27
27 -
 28
28 -
 29
29 -
 30
30 -
 31
31 -
 32
32 -
 33
33 -
 34
34 -
 35
35 -
 36
36 -
 37
37 -
 38
38 -
 39
39 -
 40
40 -
41
-
42
-
43
-
44
-
45
-
46
-
47
-
48
-
49
-
50
-
51
-
52
-
53
-
54
-
55
-
56
-
57
-
58
-
59
-
60
-
61
-
62
-
63
-
64
-
65
-
66
-
67
-
68
-
69
-
70
-
71
-
72
-
73
-
74
-
75
-
76
-
77
-
78
-
79
-
80
-
81
-
82
-
83
-
84
-
85
-
86
-
87
-
88
-
89
-
90
-
91
-
92
-
93
-
94
-
95
-
96
 |
 |
20
unrecovered theft. We sell GAP on behalf of an unrelated third party who is the primary obligor. As of
February 28, 2010, the third-party GAP provider was Safe-Guard Products International, LLC. We have no
contractual liability to the customer for this product. GAP revenue represents commissions from the unrelated third
party.
Over the long term, we believe the primary drivers for earnings growth will be vehicle unit sales growth, both from
new stores and from stores included in our comparable store base, as well as improvements in margins resulting
from operational efficiencies. We target a dollar range of gross profit per used unit sold. The gross profit dollar
target for an individual vehicle is based on a variety of factors, including its anticipated probability of sale and its
mileage relative to its age; however, it is not primarily based on the vehicle’s selling price.
Prior to fiscal 2010, we opened used car superstores at an annual rate of approximately 15% of our used car
superstore base for several consecutive years. As a result of the weak economic and sales environment, in
December 2008, we temporarily suspended store growth. This suspension reduced our capital needs and growth-
related costs. Based on the improvements in our sales and profitability in fiscal 2010, as well as the increasing
stability in the credit markets, we plan to resume store growth in fiscal 2011. We plan to take a measured approach
by opening three stores in fiscal 2011, between three and five stores in fiscal 2012, and between five and ten stores
in fiscal 2013. We are still at a relatively early stage in the national rollout of our retail concept, and as of
February 28, 2010, we had used car superstores located in markets that comprised approximately 45% of the U.S.
population.
In the near term, our principal challenges are related to the weak economic conditions and the resulting high
unemployment rate and relatively low levels of consumer confidence, all of which have caused a dramatic decline in
industry-wide auto sales when compared with pre-recessionary levels. Longer term, we believe the principal
challenges we face will include our ability to build our management bench strength to support our store growth and
our ability to procure suitable real estate. We staff each newly opened store with an experienced management team.
Therefore, we must recruit, train and develop managers and associates to fill the pipeline necessary to support future
store openings.
Fiscal 2010 Highlights
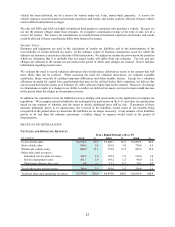
• Net sales and operating revenues increased 7% to $7.47 billion from $6.97 billion in fiscal 2009, while net
earnings increased to $281.7 million, or $1.26 per share, from $59.2 million, or $0.27 per share.
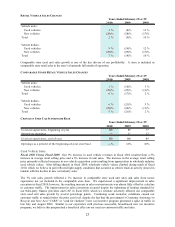
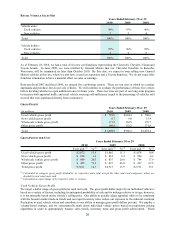
• Total used vehicle revenues increased 9% to $6.19 billion versus $5.69 billion in fiscal 2009. The average used
vehicle selling price climbed 5%, primarily reflecting increases in our acquisition costs, which have been
affected by a significant year-over-year increase in used vehicle wholesale values. Total used vehicle unit sales
rose 3%, reflecting the combination of a 1% increase in comparable store used unit sales and sales from newer
stores not yet included in the comparable store base.
• Total wholesale vehicle revenues increased 8% to $844.9 million versus $779.8 million in fiscal 2009,
reflecting the combination of a 6% rise in the average wholesale vehicle selling price and a 2% increase in
wholesale unit sales.
• Total gross profit increased 13% to $1.10 billion compared with $968.2 million in fiscal 2009, primarily
because of a significant improvement in total gross profit per unit, which climbed $296 to $3,011 per unit from
$2,715 per unit in fiscal 2009. Several factors contributed to the strength of our gross profit per unit, including
our ongoing initiative to reduce waste in the vehicle reconditioning process; the support provided by the
appreciation in used vehicle wholesale values; and continued refinements in our proprietary inventory
management systems and processes, which allowed us to increase inventory turns.
• CAF income climbed to $175.2 million compared with $15.3 million in fiscal 2009. In both periods, CAF
results were affected by adjustments related to loans originated in previous fiscal years. In fiscal 2010, the
adjustments increased CAF income by $26.7 million, or $0.07 per share, while in fiscal 2009, the adjustments
reduced CAF income by $81.8 million, or $0.23 per share. The fiscal 2010 adjustments included $64.0 million
of favorable mark-to-market adjustments primarily on retained subordinated bonds and $18.9 million of net
favorable valuation adjustments primarily related to decreases in prepayment rate and discount rate
assumptions, partially offset by $56.2 million of increased funding costs. CAF’s gain on loans originated and
sold increased to $83.0 million compared with $46.5 million in fiscal 2009. The increase primarily reflected an
increase in CAF’s gain percentage, which improved to 4.5% versus 2.4% in fiscal 2009.
• Selling, general and administrative (“SG&A”) expenses were reduced 7% to $818.7 million from $882.4
million in fiscal 2009, despite the increase in unit sales. The SG&A reduction reflected decreases in advertising
expenses and growth-related costs, as well as benefits from a variety of waste-reduction initiatives. In addition,
fiscal 2010 SG&A expenses included the benefit of a favorable litigation settlement, which increased earnings