CarMax 2010 Annual Report Download - page 2
Download and view the complete annual report
Please find page 2 of the 2010 CarMax annual report below. You can navigate through the pages in the report by either clicking on the pages listed below, or by using the keyword search tool below to find specific information within the annual report.-
 1
1 -
 2
2 -
 3
3 -
 4
4 -
 5
5 -
 6
6 -
 7
7 -
 8
8 -
 9
9 -
 10
10 -
 11
11 -
 12
12 -
 13
13 -
14
-
15
-
16
-
17
-
18
-
19
-
20
-
21
-
22
-
23
-
24
-
25
-
26
-
27
-
28
-
29
-
30
-
31
-
32
-
33
-
34
-
35
-
36
-
37
-
38
-
39
-
40
-
41
-
42
-
43
-
44
-
45
-
46
-
47
-
48
-
49
-
50
-
51
-
52
-
53
-
54
-
55
-
56
-
57
-
58
-
59
-
60
-
61
-
62
-
63
-
64
-
65
-
66
-
67
-
68
-
69
-
70
-
71
-
72
-
73
-
74
-
75
-
76
-
77
-
78
-
79
-
80
-
81
-
82
-
83
-
84
-
85
-
86
-
87
-
88
-
89
-
90
-
91
-
92
-
93
-
94
-
95
-
96
 |
 |

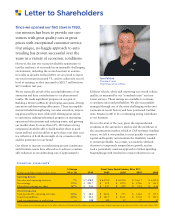
Since we opened our first store in 1993,
our mission has been to provide our cus-
tomers with great quality cars at great
prices with exceptional customer service.
Our unique, no-haggle approach to auto
retailing has proven successful over the
years in a variety of economic conditions.
However, the last two years provided the opportunity to
test the resilience of our model in an unusually challenging
environment, including the worst downturn in automo-
tive sales in decades. In fiscal 2010, we are proud to report
our total revenues increased 7%, and we achieved a record
level of earnings, as they increased to $281.7 million from
$59.2 million last year.
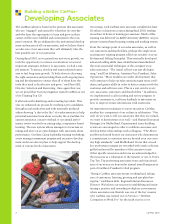
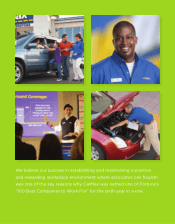
We are especially proud of the accomplishments of our
associates and their contributions to our phenomenal
results. We made significant progress on our goal of
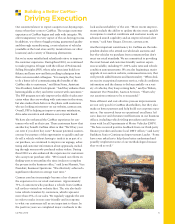
Building a Better CarMax by developing associates, driving
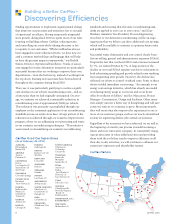
execution and discovering efficiencies. These accomplish-
ments included strengthening our sales execution; improv-
ing gross profit per unit, while still offering great values
to customers; making substantial progress on increasing
operational effectiveness and reducing waste; and growing
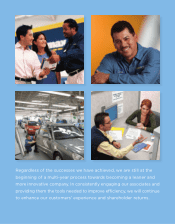
our market share by more than 10%. We believe strong
companies should be able to build market share in good
times and bad, and our ability to grow share year after year
is a reflection of both the strength of our consumer offer
and the preference for our brand.
Our efforts to increase reconditioning process consistency
and eliminate waste have allowed us to achieve a sustain-
able reduction in reconditioning cost of approximately
$200 per vehicle, while still improving our overall vehicle
quality, as measured by our “comeback ratio” and cus-
tomer surveys. These savings are available to continue
to optimize sales and profitability. We also successfully
managed through one of the most challenging credit envi-
ronments in recent history and have positioned CarMax
Auto Finance (CAF) to be a continuing strong contributor
to our business.
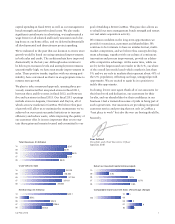
Prior to the start of the year, given the unprecedented
weakness in the automotive market and the meltdown of
the securitization market, which is CAF’s primary funding
source, we felt it was prudent to react quickly to preserve
capital and liquidity and maintain the flexibility needed
to remain profitable. As a result, we made the difficult
decision to temporarily suspend store growth, and we
took a particularly cautious approach to SG&A spending.
Suspending growth resulted in a major reduction in our
Tom Folliard
President and
Chief Executive Ocer
Letter to Shareholders
FINANCIAL HIGHLIGHTS
% Change Fiscal Years Ended February 28 or 29 (1)
(Dollars in millions except per share data) ’09 to ’10 2010 2009 2008 2007 2006
Operating Results
Net sales and operating revenues 7% $ 7,470.2 $ 6,974.0 $ 8,199.6 $ 7,465.7 $ 6,260.0
Net earnings 376% $ 281.7 $ 59.2 $ 182.0 $ 198.6 $ 134.2
Diluted net earnings per share 367% $ 1.26 $ 0.27 $ 0.82 $ 0.91 $ 0.63
Other Information
Cash provided by operating activities (81)% $ 50.3 $ 264.6 $ 79.5 $ 136.8 $ 117.5
Capital expenditures (88)% $ 22.4 $ 185.7 $ 253.1 $ 191.8 $ 194.4
Used car superstores, at end of year — 100 100 89 77 67
(1) All per share amounts have been adjusted for the effects of the fiscal 2010 implementation of the accounting pronouncement related to participating securities and the 2-for-1 stock split in March 2007.