CarMax 2010 Annual Report Download - page 37
Download and view the complete annual report
Please find page 37 of the 2010 CarMax annual report below. You can navigate through the pages in the report by either clicking on the pages listed below, or by using the keyword search tool below to find specific information within the annual report.-
 1
1 -
2
-
3
-
4
-
5
-
6
-
7
-
8
-
9
-
10
-
11
-
12
-
13
-
14
-
15
-
16
-
17
-
18
-
19
-
20
-
21
-
22
-
23
-
24
-
25
-
26
-
 27
27 -
 28
28 -
 29
29 -
 30
30 -
 31
31 -
 32
32 -
 33
33 -
 34
34 -
 35
35 -
 36
36 -
 37
37 -
 38
38 -
 39
39 -
 40
40 -
 41
41 -
 42
42 -
 43
43 -
 44
44 -
 45
45 -
 46
46 -
 47
47 -
48
-
49
-
50
-
51
-
52
-
53
-
54
-
55
-
56
-
57
-
58
-
59
-
60
-
61
-
62
-
63
-
64
-
65
-
66
-
67
-
68
-
69
-
70
-
71
-
72
-
73
-
74
-
75
-
76
-
77
-
78
-
79
-
80
-
81
-
82
-
83
-
84
-
85
-
86
-
87
-
88
-
89
-
90
-
91
-
92
-
93
-
94
-
95
-
96
 |
 |
27
customer traffic and sales are consistently strong, we generally take fewer pricing markdowns, which in turn
benefits gross profit dollars per unit. When the sales pace slows, we may initially take more pricing markdowns,
which could pressure gross profit dollars per unit. However, as we are successful in reducing inventories to align
them with a slower sales pace, this may allow us to return to target levels of gross profit per unit. Over the past
several years, we have continued to refine our car-buying strategies, which we believe has benefited used vehicle
gross profit per unit.
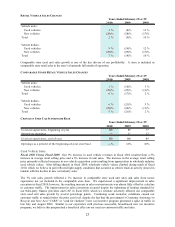
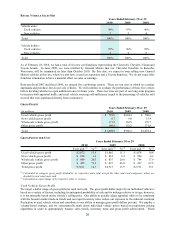
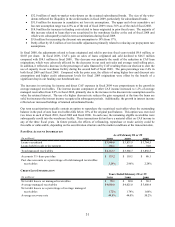
Fiscal 2010 Versus Fiscal 2009. Our used vehicle gross profit increased by $95.4 million, or 15%, to $739.9
million from $644.4 million in fiscal 2009, reflecting the combination of an 11% improvement in used vehicle gross
profit dollars per unit and the 3% increase in used unit sales. Used vehicle gross profit per unit increased $207 to
$2,072 per unit compared with $1,865 per unit in fiscal 2009. The improvement in gross profit per unit resulted
from a combination of factors, including our ongoing initiative to reduce waste in the vehicle reconditioning
process. We estimate that we achieved a sustainable reduction in average reconditioning costs of approximately
$200 per vehicle by the end of fiscal 2010. This reduction was primarily accomplished through our emphasis on the
consistent application of our reconditioning standards across our entire store base. The benefit of the year-over-year
appreciation in used vehicle wholesale values also contributed to our used vehicle gross profit. In addition, we
believe continuing refinements to our proprietary inventory management systems and processes were contributing
factors, as we were able to increase inventory turns in fiscal 2010, despite our aggressive reductions in inventory in
the previous year. The improvement also reflected the below-average profitability reported early in fiscal 2009
when the initial slowdown in customer traffic and a rapid decline in underlying values of SUVs and trucks put
pressure on our used vehicle margins.
Fiscal 2009 Versus Fiscal 2008. Our used vehicle gross profit decreased by $64.2 million, or 9%, to $644.4 million
from $708.6 million in fiscal 2008, primarily as a result of the 8% decline in total used unit sales. Despite the
difficult sales environment in fiscal 2009, gross profit per unit decreased only $13 to $1,865 per unit. Several
factors adversely affected our fiscal 2009 used vehicle gross profit per unit, including a reduction in the percent of
vehicles purchased directly from customers and the sharp decrease in wholesale industry prices. These were largely
offset, however, by our success in managing our inventories.
During fiscal 2009, we experienced a decline in both appraisal traffic and our buy rate, which required us to source a
larger percentage of our used vehicles at auction. Vehicles purchased at auction typically generate less gross profit
per unit compared with vehicles purchased directly from consumers. Additionally, wholesale industry prices for
mid-sized and large SUVs and trucks declined sharply in the spring and early summer of 2008, and this rapid
decline in valuation resulted in margin pressure on this segment of inventory in the first half of fiscal 2009.
We believe that our ability to maintain a generally consistent level of gross profit per unit during fiscal 2009, despite
the challenging sales environment and the unprecedented decline in wholesale market prices, was due in large part
to the effectiveness of our proprietary inventory management systems and processes. In response to the sharp
decline in traffic and sales that began in late May 2008, we rapidly reduced our used car inventories, which brought
them back in line with the current sales rates and minimized required pricing markdowns in the second half of the
fiscal year. Compared with inventory levels at stores open as of February 29, 2008, we had approximately 16,500
fewer total used vehicle units in inventory as of February 28, 2009, representing a 28% reduction. Due to the severe
decline in customer traffic during fiscal 2009, we generally chose not to reduce our gross profit targets, as we
believed doing so in the current economic environment would not have spurred a sufficient increase in sales to offset
the reduction in per-unit profitability.
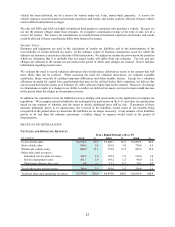
New Vehicle Gross Profit
Fiscal 2010 Versus Fiscal 2009. Our new vehicle gross profit decreased 25% to $6.7 million from $9.0 million in
fiscal 2009. The reduction primarily reflected the 29% decline in new vehicle unit sales, partially offset by a 5%
increase in new vehicle gross profit dollars per unit, which improved to $858 per unit from $814 per unit in fiscal
2009. The industry-wide reductions in new vehicle inventories and incentives related to the cash for clunkers
program benefited the new vehicle gross profit dollars per unit in the second and third quarters of fiscal 2010.
Fiscal 2009 Versus Fiscal 2008. Our new vehicle gross profit decreased 42% to $9.0 million in fiscal 2009 from
$15.4 million in fiscal 2008, reflecting the 28% reduction in total new unit sales and a $180 decline in gross profit
per unit. These reductions resulted from the sharp decline in new car industry sales and the resulting increase in
competitiveness in the new car market.