Blackberry 2010 Annual Report Download - page 96
Download and view the complete annual report
Please find page 96 of the 2010 Blackberry annual report below. You can navigate through the pages in the report by either clicking on the pages listed below, or by using the keyword search tool below to find specific information within the annual report.-
 1
1 -
2
-
3
-
4
-
5
-
6
-
7
-
8
-
9
-
10
-
11
-
12
-
13
-
14
-
15
-
16
-
17
-
18
-
19
-
20
-
21
-
22
-
23
-
24
-
25
-
26
-
27
-
28
-
29
-
30
-
31
-
32
-
33
-
34
-
35
-
36
-
37
-
38
-
39
-
40
-
41
-
42
-
43
-
44
-
45
-
46
-
47
-
48
-
49
-
50
-
51
-
52
-
53
-
54
-
55
-
56
-
57
-
58
-
59
-
60
-
61
-
62
-
63
-
64
-
65
-
66
-
67
-
68
-
69
-
70
-
71
-
72
-
73
-
74
-
75
-
76
-
77
-
78
-
79
-
80
-
81
-
82
-
83
-
84
-
85
-
 86
86 -
 87
87 -
 88
88 -
 89
89 -
 90
90 -
 91
91 -
 92
92 -
 93
93 -
 94
94 -
 95
95 -
 96
96 -
 97
97 -
 98
98
 |
 |

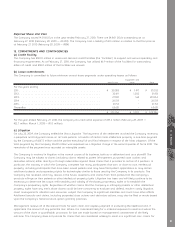
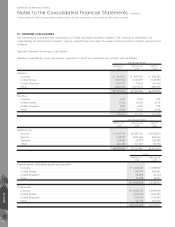
18. SEGMENT DISCLOSURES
The Company is organized and managed as a single reportable business segment. The Company’s operations are
substantially all related to the research, design, manufacture and sales of wireless communications products, services and
software.
Selected financial information is as follows:
Revenue, classified by major geographic segments in which our customers are located, was as follows:
February 27,
2010
February 28,
2009
March 1,
2008
For the year ended
Revenue
Canada .................................................................................................... $ 843,762 $ 887,005 $ 438,302
United States ............................................................................................ 8,619,762 6,967,598 3,528,858
United Kingdom ........................................................................................ 1,447,417 711,536 461,592
Other ........................................................................................................ 4,042,283 2,499,047 1,580,643
$14,953,224 $11,065,186 $6,009,395
Revenue
Canada .................................................................................................... 5.6% 8.0% 7.3%
United States ............................................................................................ 57.7% 63.0% 58.7%
United Kingdom ........................................................................................ 9.7% 6.4% 7.7%
Other ........................................................................................................ 27.0% 22.6% 26.3%
100.0% 100.0% 100.0%
February 27,
2010
February 28,
2009
March 1,
2008
For the year ended
Revenue mix
Devices ..................................................................................................... $ 12,115,765 $9,089,736 $ 4,768,610
Service ...................................................................................................... 2,158,591 1,402,560 860,641
Software ................................................................................................... 258,635 251,871 234,388
Other ........................................................................................................ 420,233 321,019 145,756
$14,953,224 $11,065,186 $6,009,395
February 27,
2010
February 28,
2009
As at
Capital assets, intangible assets and goodwill
Canada ........................................................................................................................... $ 2,605,267 $ 1,948,337
United States................................................................................................................... 682,291 482,826
United Kingdom .............................................................................................................. 46,009 49,454
Other............................................................................................................................... 99,938 58,130
$ 3,433,505 $ 2,538,747
Total assets
Canada ........................................................................................................................... $ 4,502,522 $3,218,640
United States................................................................................................................... 4,059,174 2,646,783
United Kingdom .............................................................................................................. 1,195,534 1,931,387
Other............................................................................................................................... 447,179 304,562
$10,204,409 $ 8,101,372
RESEARCH IN MOTION LIMITED
Notes to the Consolidated Financial Statements continued
In thousands of United States dollars, except share and per share data, and except as otherwise indicated
NOTE 18
88