Blackberry 2010 Annual Report Download - page 38
Download and view the complete annual report
Please find page 38 of the 2010 Blackberry annual report below. You can navigate through the pages in the report by either clicking on the pages listed below, or by using the keyword search tool below to find specific information within the annual report.-
 1
1 -
2
-
3
-
4
-
5
-
6
-
7
-
8
-
9
-
10
-
11
-
12
-
13
-
14
-
15
-
16
-
17
-
18
-
19
-
20
-
21
-
22
-
23
-
24
-
25
-
26
-
27
-
 28
28 -
 29
29 -
 30
30 -
 31
31 -
 32
32 -
 33
33 -
 34
34 -
 35
35 -
 36
36 -
 37
37 -
 38
38 -
 39
39 -
 40
40 -
 41
41 -
 42
42 -
 43
43 -
 44
44 -
 45
45 -
 46
46 -
 47
47 -
 48
48 -
49
-
50
-
51
-
52
-
53
-
54
-
55
-
56
-
57
-
58
-
59
-
60
-
61
-
62
-
63
-
64
-
65
-
66
-
67
-
68
-
69
-
70
-
71
-
72
-
73
-
74
-
75
-
76
-
77
-
78
-
79
-
80
-
81
-
82
-
83
-
84
-
85
-
86
-
87
-
88
-
89
-
90
-
91
-
92
-
93
-
94
-
95
-
96
-
97
-
98
 |
 |

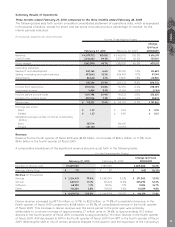
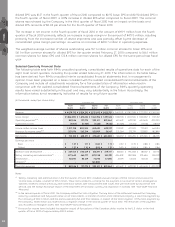
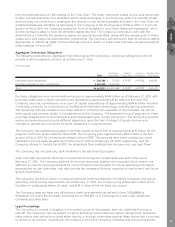
There were no adjustments to U.S. GAAP net income in the third and fourth quarters of fiscal 2010.
The following table provides a reconciliation of net income to adjusted net income and diluted earnings per
share to adjusted diluted earnings per share for the fiscal year ended February 27, 2010:
February 27,
2010
February 28,
2009
For the Fiscal Year Ended
Net income .................................................................................................................................................. $2,457,144 $ 1,892,616
Visto Litigation (net of tax)........................................................................................................................... 112,809 –
Foreign exchange impact on the enactment of functional currency tax rules (net of tax) .......................... 37,396 –
Provision for employee tax obligations for stock options (net of tax) ......................................................... 28,952 –
Tax benefit recorded on enactment of functional currency tax rules .......................................................... (145,000) –
Foreign exchange impact on Canadian income taxes................................................................................ –99,700
Adjusted net income .................................................................................................................................... $2,491,301 $ 1,992,316
Diluted earnings per share.......................................................................................................................... $ 4.31 $ 3.30
Adjusted diluted earnings per share............................................................................................................ $ 4.37 $ 3.47
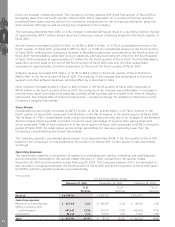
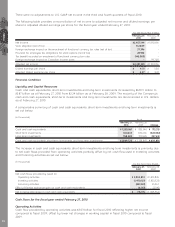
Financial Condition
Liquidity and Capital Resources
Cash and cash equivalents, short-term investments and long-term investments increased by $630.9 million to
$2.87 billion as at February 27, 2010 from $2.24 billion as at February 28, 2009. The majority of the Company’s
cash and cash equivalents, short-term investments and long-term investments are denominated in U.S. dollars
as at February 27, 2010.
A comparative summary of cash and cash equivalents, short-term investments and long-term investments is
set out below:
(in thousands)
February 27,
2010
February 28,
2009 Change
As at
Cash and cash equivalents....................................................................................................... $ 1,550,861 $ 835,546 $ 715,315
Short-term investments.............................................................................................................. 360,614 682,666 (322,052)
Long-term investments .............................................................................................................. 958,248 720,635 237,613
Cash and cash equivalents, short-term investments and long-term investments...................... $2,869,723 $ 2,238,847 $ 630,876
The increase in cash and cash equivalents, short-term investments and long-term investments is primarily due
to net cash flows provided from operating activities partially offset by net cash flow used in investing activities
and financing activities as set out below:
(in thousands)
February 27,
2010
February 28,
2009
For the Fiscal Year Ended
Net cash flows provided by (used in):
Operating activities.................................................................................................................................. $ 3,034,874 $ 1,451,845
Investing activities.................................................................................................................................... (1,470,127) (1,823,523)
Financing activities .................................................................................................................................. (843,381) 25,367
Effect of foreign exchange gain on cash and cash equivalents................................................................. (6,051) (2,541)
Net increase (decrease) in cash and cash equivalents............................................................................... $ 715,315 $ (348,852)
Cash flows for the fiscal year ended February 27, 2010
Operating Activities
Cash flow provided by operating activities was $3.03 billion for fiscal 2010 reflecting higher net income
compared to fiscal 2009, offset by lower net changes in working capital in fiscal 2010 compared to fiscal
2009.
MD&A
30