Blackberry 2010 Annual Report Download - page 64
Download and view the complete annual report
Please find page 64 of the 2010 Blackberry annual report below. You can navigate through the pages in the report by either clicking on the pages listed below, or by using the keyword search tool below to find specific information within the annual report.-
 1
1 -
2
-
3
-
4
-
5
-
6
-
7
-
8
-
9
-
10
-
11
-
12
-
13
-
14
-
15
-
16
-
17
-
18
-
19
-
20
-
21
-
22
-
23
-
24
-
25
-
26
-
27
-
28
-
29
-
30
-
31
-
32
-
33
-
34
-
35
-
36
-
37
-
38
-
39
-
40
-
41
-
42
-
43
-
44
-
45
-
46
-
47
-
48
-
49
-
50
-
51
-
52
-
53
-
 54
54 -
 55
55 -
 56
56 -
 57
57 -
 58
58 -
 59
59 -
 60
60 -
 61
61 -
 62
62 -
 63
63 -
 64
64 -
 65
65 -
 66
66 -
 67
67 -
 68
68 -
 69
69 -
 70
70 -
 71
71 -
 72
72 -
 73
73 -
 74
74 -
75
-
76
-
77
-
78
-
79
-
80
-
81
-
82
-
83
-
84
-
85
-
86
-
87
-
88
-
89
-
90
-
91
-
92
-
93
-
94
-
95
-
96
-
97
-
98
 |
 |

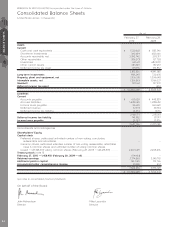
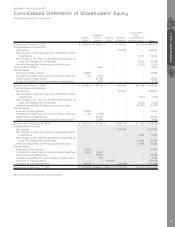
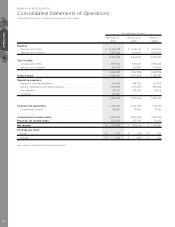
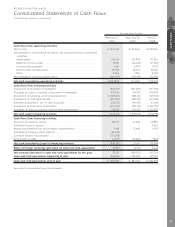
RESEARCH IN MOTION LIMITED
Consolidated Statements of Operations
(United States dollars, in thousands, except per share data)
February 27,
2010
February 28,
2009
March 1,
2008
For the Year Ended
Revenue
Devices and other ........................................................................... $ 12,535,998 $ 9,410,755 $ 4,914,366
Service and software ...................................................................... 2,417,226 1,654,431 1,095,029
14,953,224 11,065,186 6,009,395
Cost of sales
Devices and other ........................................................................... 7,979,163 5,718,041 2,758,250
Service and software ...................................................................... 389,795 249,847 170,564
8,368,958 5,967,888 2,928,814
Gross margin ...................................................................................... 6,584,266 5,097,298 3,080,581
Operating expenses
Research and development ............................................................. 964,841 684,702 359,828
Selling, marketing and administration ............................................. 1,907,398 1,495,697 881,482
Amortization.................................................................................... 310,357 194,803 108,112
Litigation ........................................................................................ 163,800 – –
3,346,396 2,375,202 1,349,422
Income from operations ..................................................................... 3,237,870 2,722,096 1,731,159
Investment income .......................................................................... 28,640 78,267 79,361
Income before income taxes ............................................................... 3,266,510 2,800,363 1,810,520
Provision for income taxes .................................................................. 809,366 907,747 516,653
Net income ......................................................................................... $ 2,457,144 $ 1,892,616 $ 1,293,867
Earnings per share
Basic .............................................................................................. $ 4.35 $ 3.35 $ 2.31
Diluted............................................................................................ $ 4.31 $ 3.30 $ 2.26
See notes to consolidated financial statements
OPERATIONS
56