Blackberry 2010 Annual Report Download - page 31
Download and view the complete annual report
Please find page 31 of the 2010 Blackberry annual report below. You can navigate through the pages in the report by either clicking on the pages listed below, or by using the keyword search tool below to find specific information within the annual report.-
 1
1 -
2
-
3
-
4
-
5
-
6
-
7
-
8
-
9
-
10
-
11
-
12
-
13
-
14
-
15
-
16
-
17
-
18
-
19
-
20
-
 21
21 -
 22
22 -
 23
23 -
 24
24 -
 25
25 -
 26
26 -
 27
27 -
 28
28 -
 29
29 -
 30
30 -
 31
31 -
 32
32 -
 33
33 -
 34
34 -
 35
35 -
 36
36 -
 37
37 -
 38
38 -
 39
39 -
 40
40 -
 41
41 -
42
-
43
-
44
-
45
-
46
-
47
-
48
-
49
-
50
-
51
-
52
-
53
-
54
-
55
-
56
-
57
-
58
-
59
-
60
-
61
-
62
-
63
-
64
-
65
-
66
-
67
-
68
-
69
-
70
-
71
-
72
-
73
-
74
-
75
-
76
-
77
-
78
-
79
-
80
-
81
-
82
-
83
-
84
-
85
-
86
-
87
-
88
-
89
-
90
-
91
-
92
-
93
-
94
-
95
-
96
-
97
-
98
 |
 |

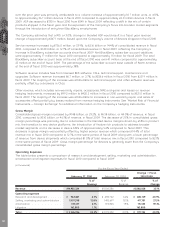
Research and Development
Research and development expenditures increased by $324.9 million to $684.7 million, or 6.2% of revenue, in
fiscal 2009, compared to $359.8 million, or 6.0% of revenue, in fiscal 2008. The majority of the increases during
fiscal 2009 compared to fiscal 2008 were attributable to salaries and benefits due to an increase in the
average headcount associated with research and development activities, new product development costs,
travel and office and related staffing infrastructure costs.
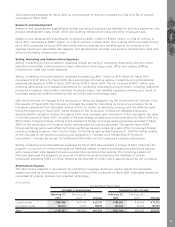
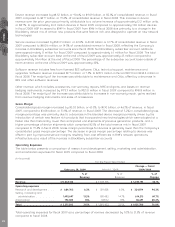
Selling, Marketing and Administration Expenses
Selling, marketing and administration expenses increased by $614.2 million to $1.50 billion for fiscal 2009
compared to $881.5 million for the comparable period in fiscal 2008. As a percentage of revenue, selling,
marketing and administration expenses decreased to 13.5% in fiscal 2009 compared to 14.7% in fiscal 2008.
The net increase was primarily attributable to increased expenditures for marketing, advertising and
promotion expenses including additional programs to support new product launches, salary and benefits
expenses primarily as a result of increased personnel, external advisory fees, office and related staffing
infrastructure costs and travel expenses.
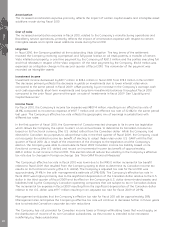
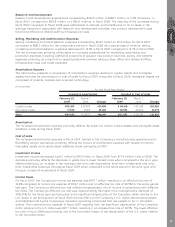
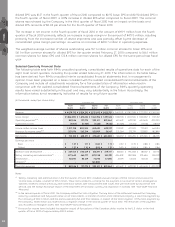
Amortization Expense
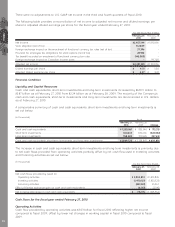
The table below presents a comparison of amortization expense relating to capital assets and intangible
assets recorded as amortization or cost of sales for fiscal 2009 compared to fiscal 2008. Intangible assets are
comprised of patents, licenses and acquired technology.
(in thousands)
February 28,
2009
March 1,
2008 Change
February 28,
2009
March 1,
2008 Change
Included in Amortization Included in Cost of sales
For the Fiscal Year Ended
Capital assets ........................... $ 119,209 $ 87,800 $31,409 $ 84,168 $ 45,248 $38,920
Intangible assets ....................... 75,594 20,312 55,282 48,925 24,006 24,919
Total ......................................... $194,803 $ 108,112 $86,691 $133,093 $ 69,254 $63,839
Amortization
The increased amortization expense primarily reflects the impact of certain capital assets and intangible asset
additions made during fiscal 2009.
Cost of sales
The increased amortization expense in fiscal 2009, related to the Company’s manufacturing operations and
BlackBerry service operations, primarily reflects the impact of amortization expense with respect to certain
intangible assets and capital asset additions made during fiscal 2009.
Investment Income
Investment income decreased by $1.1 million to $78.3 million in fiscal 2009 from $79.4 million in fiscal 2008. The
decrease primarily reflects the decrease in yields due to lower interest rates when compared to the prior year,
offset partially by an increase in the average cash and cash equivalents, short-term investments and long-
term investments balances throughout fiscal 2009 when compared to the same period in the prior year and
the gain on sale of investments in fiscal 2009.
Income Taxes
For fiscal 2009, the Company’s income tax expense was $907.7 million, resulting in an effective tax rate of
32.4% compared to income tax expense of $516.7 million and an effective tax rate of 28.5% for the same period
last year. The Company’s effective tax rate reflects the geographic mix of income in jurisdictions with different
tax rates. The Company’s effective tax rate was approximately 3% higher than management’s estimate of
29%-30% for the fiscal year primarily due to the significant depreciation of the Canadian dollar relative to the
U.S. dollar in the third quarter of fiscal 2009 and its effect on the Company’s U.S. dollar denominated assets
and liabilities held by the Company’s Canadian operating companies that are subject to tax in Canadian
dollars. The incremental tax expense in fiscal 2009 resulting from the significant depreciation of the Canadian
dollar relative to the U.S. dollar was $99.7 million resulting in an adjusted tax rate of 28.9%. The lower effective
tax rate in fiscal 2008 was primarily due to the favorable impact of the depreciation of the U.S. dollar relative
to the Canadian dollar.
MD&A
23