Blackberry 2010 Annual Report Download - page 39
Download and view the complete annual report
Please find page 39 of the 2010 Blackberry annual report below. You can navigate through the pages in the report by either clicking on the pages listed below, or by using the keyword search tool below to find specific information within the annual report.-
 1
1 -
2
-
3
-
4
-
5
-
6
-
7
-
8
-
9
-
10
-
11
-
12
-
13
-
14
-
15
-
16
-
17
-
18
-
19
-
20
-
21
-
22
-
23
-
24
-
25
-
26
-
27
-
28
-
 29
29 -
 30
30 -
 31
31 -
 32
32 -
 33
33 -
 34
34 -
 35
35 -
 36
36 -
 37
37 -
 38
38 -
 39
39 -
 40
40 -
 41
41 -
 42
42 -
 43
43 -
 44
44 -
 45
45 -
 46
46 -
 47
47 -
 48
48 -
 49
49 -
50
-
51
-
52
-
53
-
54
-
55
-
56
-
57
-
58
-
59
-
60
-
61
-
62
-
63
-
64
-
65
-
66
-
67
-
68
-
69
-
70
-
71
-
72
-
73
-
74
-
75
-
76
-
77
-
78
-
79
-
80
-
81
-
82
-
83
-
84
-
85
-
86
-
87
-
88
-
89
-
90
-
91
-
92
-
93
-
94
-
95
-
96
-
97
-
98
 |
 |

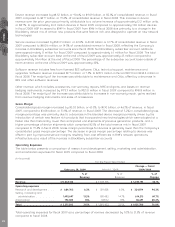
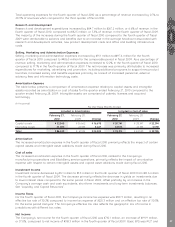
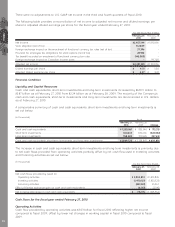
The table below summarizes the current assets, current liabilities, working capital and certain working capital
items of the Company:
(in thousands)
February 27,
2010
February 28,
2009 Change
As at
Current assets ............................................................................................................................. $ 5,812,656 $ 4,841,586 $ 971,070
Current liabilities.......................................................................................................................... 2,431,777 2,115,351 316,426
Working capital........................................................................................................................... $3,380,879 $ 2,726,235 $654,644
The increase in current assets of $971.1 million at the end of fiscal 2010 from the end of fiscal 2009 was
primarily due to an increase in accounts receivables of $481.6 million and cash, cash equivalents and short
term investments of $393.3 million. At the end of fiscal 2010, accounts receivables were approximately
$2.59 billion, an increase of $481.6 million from the end of fiscal 2009 due to increased sales and customer mix.
Days sales outstanding increased to 58 days in the fourth quarter of fiscal 2010 from 56 days at the end of
fiscal 2009, primarily due to geographic and customer mix of sales in the quarter.
The increase in current liabilities of $316.4 million at the end of fiscal 2010 from the end of fiscal 2009 was
primarily due to increases in accrued liabilities and accounts payable, partially offset by a reduction in
income taxes payable. As at February 27, 2010, accrued liabilities were approximately $1.64 billion, an increase
of $400.0 million from the end of fiscal 2009 primarily due to vendor inventory liabilities. The increase of
accounts payable of $167.3 million from the end of fiscal 2009 was due primarily to the timing of payments
during the fourth quarter of fiscal 2010. The decrease in income taxes payable as at February 27, 2010 of
$265.8 million compared to the end of fiscal 2009 was partially due to the Government of Canada enacting
changes to its income tax legislation in the first quarter of fiscal 2010 enabling the Company the option to
elect, on an annual basis, to determine its Canadian income tax results on its functional currency (the U.S.
dollar) rather than the Canadian dollar. The remaining decrease in income taxes payable as at February 27,
2010 was a function of the payment of the Company’s fiscal 2009 income tax liabilities in fiscal 2010 and the
timing of the Company’s fiscal 2010 income tax installment payments relative to its current income tax
expense for fiscal 2010.
Investing Activities
During the fiscal year ended February 27, 2010, cash flow used in investing activities was $1.47 billion and
included capital asset additions of $1.01 billion, intangible asset additions of $421.4 million and business
acquisitions of $143.4 million, offset by cash flow provided by transactions involving the proceeds on sale or
maturity of short-term investments and long-term investments, net of the costs of acquisitions in the amount of
$104.1 million. For the same period of the prior fiscal year, cash flow used in investing activities was $1.82 billion
and included capital asset additions of $833.5 million, intangible asset additions of $687.9 million, business
acquisitions of $48.4 million as well as transactions involving the proceeds on sale or maturity of short-term
investments and long-term investments, net of the costs of acquisitions in the amount of $253.7 million.
The increase in capital asset spending was primarily due to increased investment in buildings, renovations to
existing facilities, expansion and enhancement of the BlackBerry infrastructure and computer equipment
purchases. Investments in intangible assets in fiscal 2010 was primarily associated with the settlement of the
Visto Litigation, see “Results of Operations — Litigation” for the fiscal year ended February 27, 2010 and
agreements with third parties for use of intellectual property. Business acquisitions in fiscal 2010 related to the
purchases of Certicom Corp. and Torch Mobile Inc., the purchase of a company whose proprietary software
will be incorporated into the Company’s software and the purchase of certain assets of a company that will
be used in next generation wireless technologies.
Financing Activities
Cash flow used in financing activities was $843.4 million for fiscal 2010 and was primarily attributable to the
Common Share Repurchase Program described above in the amount of $775.0 million, purchases of common
shares on the open market by a trustee selected by the Company in connection with its Restricted Share Unit
Plan, which are classified on the balance sheet for accounting purposes as Treasury Shares in the amount of
$94.5 million, the repayment of debt acquired through acquisitions in the amount of $6.1 million, offset partially
by the proceeds from the exercise of stock options in the amount of $30.2 million and tax benefits from the
exercise of stock options. Cash flow provided by financing activities was $25.4 million for fiscal 2009 and was
primarily provided by the proceeds from the exercise of stock options and tax benefits from the exercise of
stock options, offset in part by repayment of the long-term debt.
MD&A
31