Blackberry 2010 Annual Report Download - page 29
Download and view the complete annual report
Please find page 29 of the 2010 Blackberry annual report below. You can navigate through the pages in the report by either clicking on the pages listed below, or by using the keyword search tool below to find specific information within the annual report.-
 1
1 -
2
-
3
-
4
-
5
-
6
-
7
-
8
-
9
-
10
-
11
-
12
-
13
-
14
-
15
-
16
-
17
-
18
-
 19
19 -
 20
20 -
 21
21 -
 22
22 -
 23
23 -
 24
24 -
 25
25 -
 26
26 -
 27
27 -
 28
28 -
 29
29 -
 30
30 -
 31
31 -
 32
32 -
 33
33 -
 34
34 -
 35
35 -
 36
36 -
 37
37 -
 38
38 -
 39
39 -
40
-
41
-
42
-
43
-
44
-
45
-
46
-
47
-
48
-
49
-
50
-
51
-
52
-
53
-
54
-
55
-
56
-
57
-
58
-
59
-
60
-
61
-
62
-
63
-
64
-
65
-
66
-
67
-
68
-
69
-
70
-
71
-
72
-
73
-
74
-
75
-
76
-
77
-
78
-
79
-
80
-
81
-
82
-
83
-
84
-
85
-
86
-
87
-
88
-
89
-
90
-
91
-
92
-
93
-
94
-
95
-
96
-
97
-
98
 |
 |

Net Income
Net income was $2.46 billion, or $4.35 basic EPS and $4.31 diluted EPS, in fiscal 2010 compared to net income of
$1.89 billion, or $3.35 basic EPS and $3.30 diluted EPS, in the prior fiscal year. The common shares repurchased
by the Company in the third quarter of fiscal 2010 had an impact on the basic and diluted EPS amounts of
$0.03 per share for fiscal 2010.
Adjusted net income for fiscal 2010 was $2.49 billion and adjusted diluted EPS was $4.37 in fiscal 2010. See
“Non-GAAP Financial Measures”.
The $564.5 million increase in net income in fiscal 2010 reflects primarily an increase in gross margin in the
amount of $1.48 billion, resulting primarily from the increased number of device shipments, additional
subscriber accounts and a decrease in the provision of income taxes of $98.4 million, which included a benefit
of $145.0 million, which was partially offset by the decrease in consolidated gross margin percentage, as well
as an increase of $971.2 million in the Company’s operating expenses, which included a litigation charge of
$163.8 million relating to the Visto Litigation and unusual charges of $96.4 million. See “Results of Operations —
Selling, Marketing and Administration Expenses”, “Results of Operations — Litigation” and “Results of
Operations — Income Taxes” for the year ended February 27, 2010.
The weighted average number of shares outstanding was 564.5 million common shares for basic EPS and
569.8 million common shares for diluted EPS for the fiscal year ended February 27, 2010 compared to
565.1 million common shares for basic EPS and 574.2 million common shares for diluted EPS for the fiscal year
ended February 28, 2009.
Common Shares Outstanding
On March 30, 2010, there were 557.4 million common shares, 8.9 million options to purchase common shares,
1.4 million restricted share units outstanding and 34,801 deferred share units outstanding.
The Company has not paid any cash dividends during the last three fiscal years.
On November 4, 2009, the Company’s Board of Directors authorized a Common Share Repurchase Program for
the repurchase and cancellation through the facilities of the NASDAQ Stock Market, common shares having an
aggregate purchase price of up to $1.2 billion, or approximately 21 million common shares based on trading
prices at the time of the authorization. This represents approximately 3.6% of the outstanding common shares of
the Company at the time of the authorization. In the third quarter of fiscal 2010, the Company repurchased
12.3 million common shares at a cost of $775.0 million pursuant to the Common Share Repurchase Program.
There was a reduction of $46.5 million to capital stock in the third quarter of fiscal 2010 and the amounts paid in
excess of the per share paid-in capital of the common shares of $728.5 million were charged to retained
earnings. All common shares repurchased by the Company pursuant to the Common Share Repurchase
Program have been cancelled. The Common Share Repurchase Program will remain in place for up to 12 months
from November 4, 2009 or until the purchases are completed or the program is terminated by the Company.
Fiscal year end February 28, 2009 compared to fiscal year ended March 1, 2008
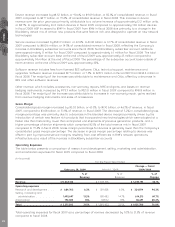
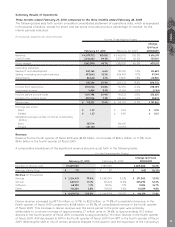
Revenue
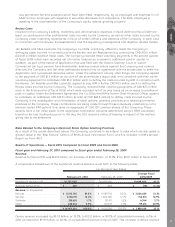
Revenue for fiscal 2009 was $11.07 billion, an increase of $5.06 billion, or 84.1%, from $6.01 billion in fiscal 2008.
A comparative breakdown of the significant revenue streams is set forth in the following table:
February 28, 2009 March 1, 2008
Change Fiscal
2009/2008
For the Fiscal Year Ended
Number of devices sold ................ 26,009,000 13,780,000 12,229,000 88.7%
Average Selling Price .................... $349 $346 $ 3 0.9%
Revenue (in thousands)
Devices......................................... $ 9,089,736 82.1% $ 4,768,610 79.4% $ 4,321,126 90.6%
Service ......................................... 1,402,560 12.7% 860,641 14.3% 541,919 63.0%
Software....................................... 251,871 2.3% 234,388 3.9% 17,483 7.5%
Other............................................ 321,019 2.9% 145,756 2.4% 175,263 120.2%
$ 11,065,186 100.0% $ 6,009,395 100.0% $ 5,055,791 84.1%
MD&A
21