Blackberry 2010 Annual Report Download - page 91
Download and view the complete annual report
Please find page 91 of the 2010 Blackberry annual report below. You can navigate through the pages in the report by either clicking on the pages listed below, or by using the keyword search tool below to find specific information within the annual report.-
 1
1 -
2
-
3
-
4
-
5
-
6
-
7
-
8
-
9
-
10
-
11
-
12
-
13
-
14
-
15
-
16
-
17
-
18
-
19
-
20
-
21
-
22
-
23
-
24
-
25
-
26
-
27
-
28
-
29
-
30
-
31
-
32
-
33
-
34
-
35
-
36
-
37
-
38
-
39
-
40
-
41
-
42
-
43
-
44
-
45
-
46
-
47
-
48
-
49
-
50
-
51
-
52
-
53
-
54
-
55
-
56
-
57
-
58
-
59
-
60
-
61
-
62
-
63
-
64
-
65
-
66
-
67
-
68
-
69
-
70
-
71
-
72
-
73
-
74
-
75
-
76
-
77
-
78
-
79
-
80
-
 81
81 -
 82
82 -
 83
83 -
 84
84 -
 85
85 -
 86
86 -
 87
87 -
 88
88 -
 89
89 -
 90
90 -
 91
91 -
 92
92 -
 93
93 -
 94
94 -
 95
95 -
 96
96 -
 97
97 -
 98
98
 |
 |

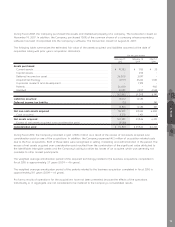
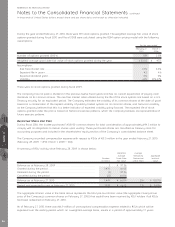
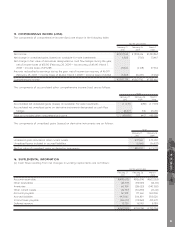
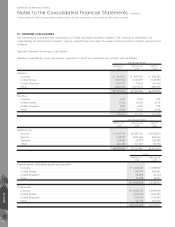
15. COMPREHENSIVE INCOME (LOSS)
The components of comprehensive income (loss) are shown in the following table:
February 27,
2010
February 28,
2009
March 1,
2008
For the year ended
Net income ........................................................................................................................... $2,457,144 $ 1,892,616 $1,293,867
Net change in unrealized gains (losses) on available- for-sale investments ........................ 6,803 (7,161) 13,467
Net change in fair value of derivatives designated as cash flow hedges during the year,
net of income taxes of $13,190 (February 28, 2009 — tax recovery of $8,641; March 1,
2008 — income taxes of $19,238) ....................................................................................... 28,324 (6,168) 37,564
Amounts reclassified to earnings during the year, net of income tax recovery of $6,079
(February 28, 2009 — income taxes of $4,644; March 1, 2008 — income taxes of $5,142) .. 15,508 (16,497) (9,232)
Comprehensive income......................................................................................................... $2,507,779 $1,862,790 $1,335,666
The components of accumulated other comprehensive income (loss) are as follows:
February 27,
2010
February 28,
2009
March 1,
2008
As at
Accumulated net unrealized gains (losses) on available- for-sale investments........................ $ 6,715 $(88) $ 7,073
Accumulated net unrealized gains on derivative instruments designated as cash flow
hedges.................................................................................................................................. 44,377 545 23,210
Total accumulated other comprehensive income..................................................................... $51,092 $457 $30,283
The components of unrealized gains (losses) on derivative instruments are as follows:
February 27,
2010
February 28,
2009
As at
Unrealized gains included in other current assets..................................................................................... $97,261 $ 70,100
Unrealized losses included in accrued liabilities........................................................................................ (6,164) (56,827)
Net fair value of unrealized gains on derivative instruments..................................................................... $91,097 $ 13,273
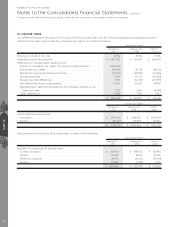
16. SUPPLEMENTAL INFORMATION
(a) Cash flows resulting from net changes in working capital items are as follows:
February 27,
2010
February 28,
2009
March 1,
2008
For the year ended
Accounts receivable............................................................................................................... $(480,610) $(936,514) $(602,055)
Other receivables .................................................................................................................. (44,719) (83,039) (34,515)
Inventories............................................................................................................................. 60,789 (286,133) (140,360)
Other current assets.............................................................................................................. (52,737) (50,280) (26,161)
Accounts payable ................................................................................................................. 167,281 177,263 140,806
Accrued liabilities................................................................................................................... 442,065 506,859 383,020
Income taxes payable .......................................................................................................... (266,517) (113,868) 401,270
Deferred revenue................................................................................................................... 13,739 16,598 8,789
$ (160,709) $ (769,114) $ 130,794
NOTES 15 16
83