Blackberry 2010 Annual Report Download - page 26
Download and view the complete annual report
Please find page 26 of the 2010 Blackberry annual report below. You can navigate through the pages in the report by either clicking on the pages listed below, or by using the keyword search tool below to find specific information within the annual report.-
 1
1 -
2
-
3
-
4
-
5
-
6
-
7
-
8
-
9
-
10
-
11
-
12
-
13
-
14
-
15
-
 16
16 -
 17
17 -
 18
18 -
 19
19 -
 20
20 -
 21
21 -
 22
22 -
 23
23 -
 24
24 -
 25
25 -
 26
26 -
 27
27 -
 28
28 -
 29
29 -
 30
30 -
 31
31 -
 32
32 -
 33
33 -
 34
34 -
 35
35 -
 36
36 -
37
-
38
-
39
-
40
-
41
-
42
-
43
-
44
-
45
-
46
-
47
-
48
-
49
-
50
-
51
-
52
-
53
-
54
-
55
-
56
-
57
-
58
-
59
-
60
-
61
-
62
-
63
-
64
-
65
-
66
-
67
-
68
-
69
-
70
-
71
-
72
-
73
-
74
-
75
-
76
-
77
-
78
-
79
-
80
-
81
-
82
-
83
-
84
-
85
-
86
-
87
-
88
-
89
-
90
-
91
-
92
-
93
-
94
-
95
-
96
-
97
-
98
 |
 |

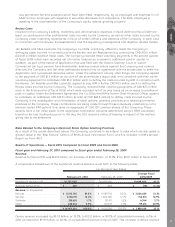
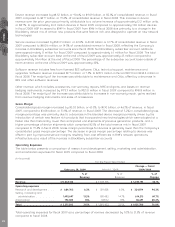
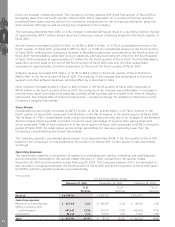
over the prior year was primarily attributable to a volume increase of approximately 10.7 million units, or 41.1%,
to approximately 36.7 million devices in fiscal 2010 compared to approximately 26.0 million devices in fiscal
2009. ASP decreased to $330 in fiscal 2010 from $349 in fiscal 2009 reflecting a shift in the mix of certain
products shipped in the fiscal year and the expansion of the Company’s focus into broader market segments
through the introduction of entry-level BlackBerry smartphones.
The Company estimates that a $10, or 3.0%, change in blended ASP would result in a fiscal year revenue
change of approximately $367.1 million, based upon the Company’s volume of devices shipped in fiscal 2010.
Service revenue increased by $756.0 million, or 53.9%, to $2.16 billion or 14.4% of consolidated revenue in fiscal
2010, compared to $1.40 billion, or 12.7% of consolidated revenue in fiscal 2009, reflecting the Company’s
increase in BlackBerry subscriber accounts since fiscal 2009. Net BlackBerry subscriber account additions
were approximately 17 million for fiscal 2010 compared to approximately 11 million for fiscal 2009. The total
BlackBerry subscriber account base at the end of fiscal 2010 was over 41 million compared to approximately
25 million at the end of fiscal 2009. The percentage of the subscriber account base outside of North America
at the end of fiscal 2010 was approximately 38%.
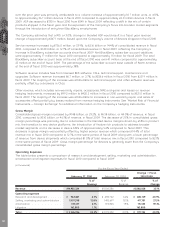
Software revenue includes fees from licensed BES software, CALs, technical support, maintenance and
upgrades. Software revenue increased $6.7 million, or 2.7%, to $258.6 million in fiscal 2010 from $251.9 million in
fiscal 2009. The majority of the increase was attributable to technical support and other software revenues,
partially offset by a decrease in CALs.
Other revenue, which includes non-warranty repairs, accessories, NRE and gains and losses on revenue
hedging instruments, increased by $99.2 million to $420.2 million in fiscal 2010 compared to $321.0 million in
fiscal 2009. The majority of the increase was attributable to increases in non-warranty repair and sales of
accessories offset partially by losses realized from revenue hedging instruments. See “Market Risk of Financial
Instruments — Foreign Exchange” for additional information on the Company’s hedging instruments.
Gross Margin
Consolidated gross margin increased by $1.48 billion, or 29.2%, to $6.58 billion, or 44.0% of revenue, in fiscal
2010, compared to $5.10 billion, or 46.1% of revenue, in fiscal 2009. The decrease of 2.1% in consolidated gross
margin percentage was primarily due to a decrease in the blended device margins driven by shifts in product
mix, the transition to new device platforms, the introduction of feature rich products to address broader
market segments, and a decrease in device ASPs of approximately 5.4% compared to fiscal 2009. This
decrease in gross margin was partially offset by higher service revenue which comprised 14.4% of total
revenue mix in fiscal 2010 compared to 12.7% in the same period of fiscal 2009 along with a lower percentage
of revenue from device shipments which comprised 81.0% of total revenue mix in fiscal 2010 compared to 82.1%
in the same period of fiscal 2009. Gross margin percentage for devices is generally lower than the Company’s
consolidated gross margin percentage.
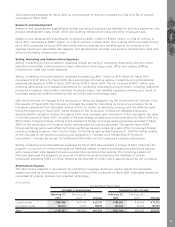
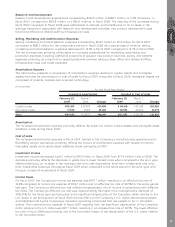
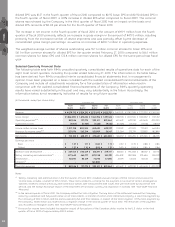
Operating Expenses
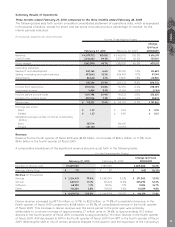
The table below presents a comparison of research and development, selling, marketing and administration,
amortization and litigation expenses for fiscal 2010 compared to fiscal 2009.
(in thousands)
%of
Revenue
%of
Revenue
%of
Change
February 27, 2010 February 28, 2009
Change — Fiscal
2010/2009
For the Fiscal Year Ended
Revenue ............................................... $14,953,224 $11,065,186 $3,888,038 35.1%
Operating expenses
Research and development .................. $ 964,841 6.5% $ 684,702 6.2% $ 280,139 40.9%
Selling, marketing and administration .. 1,907,398 12.8% 1,495,697 13.5% 411,701 27.5%
Amortization ... ...................................... 310,357 2.1% 194,803 1.8% 115,554 59.3%
Litigation.............................................. 163,800 1.1% ––163,800 –
Total .................................................... $ 3,346,396 22.5% $ 2,375,202 21.5% $ 971,194 40.9%
MD&A
18