Blackberry 2010 Annual Report Download - page 27
Download and view the complete annual report
Please find page 27 of the 2010 Blackberry annual report below. You can navigate through the pages in the report by either clicking on the pages listed below, or by using the keyword search tool below to find specific information within the annual report.-
 1
1 -
2
-
3
-
4
-
5
-
6
-
7
-
8
-
9
-
10
-
11
-
12
-
13
-
14
-
15
-
16
-
 17
17 -
 18
18 -
 19
19 -
 20
20 -
 21
21 -
 22
22 -
 23
23 -
 24
24 -
 25
25 -
 26
26 -
 27
27 -
 28
28 -
 29
29 -
 30
30 -
 31
31 -
 32
32 -
 33
33 -
 34
34 -
 35
35 -
 36
36 -
 37
37 -
38
-
39
-
40
-
41
-
42
-
43
-
44
-
45
-
46
-
47
-
48
-
49
-
50
-
51
-
52
-
53
-
54
-
55
-
56
-
57
-
58
-
59
-
60
-
61
-
62
-
63
-
64
-
65
-
66
-
67
-
68
-
69
-
70
-
71
-
72
-
73
-
74
-
75
-
76
-
77
-
78
-
79
-
80
-
81
-
82
-
83
-
84
-
85
-
86
-
87
-
88
-
89
-
90
-
91
-
92
-
93
-
94
-
95
-
96
-
97
-
98
 |
 |

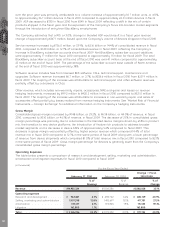
Total operating expenses for fiscal 2010 as a percentage of revenue increased by 1.0% to 22.5% of revenue
compared to fiscal 2009.
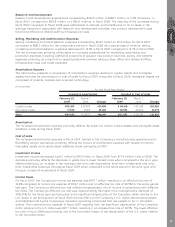
Research and Development
Research and development expenditures consist primarily of salaries and benefits for technical personnel, new
product development costs, travel, office and building infrastructure costs and other employee costs.
Research and development expenditures increased by $280.1 million to $964.8 million, or 6.5% of revenue, in
fiscal 2010, compared to $684.7 million, or 6.2% of revenue, in fiscal 2009. The majority of the increases during
fiscal 2010 compared to fiscal 2009 were attributable to salaries and benefits due to an increase in the
average headcount associated with research and development activities, new product development costs and
office and building infrastructure costs.
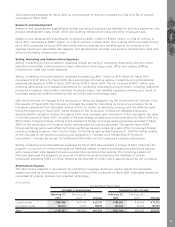
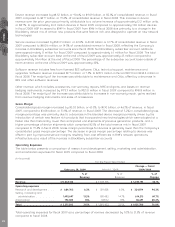
Selling, Marketing and Administration Expenses
Selling, marketing and administration expenses consist primarily of marketing, advertising and promotion,
salaries and benefits, external advisory fees, information technology costs, office and related staffing
infrastructure costs and travel expenses.
Selling, marketing and administration expenses increased by $411.7 million to $1.91 billion for fiscal 2010
compared to $1.50 billion for fiscal 2009. As a percentage of revenue, selling, marketing and administration
expenses decreased to 12.8% in fiscal 2010 versus 13.5% in fiscal 2009. The net increase of $411.7 million was
primarily attributable to increased expenditures for marketing, advertising and promotion, including additional
programs to support new product launches, increased salary and benefits expenses primarily as a result of
increased personnel, external advisory fees and information technology costs.
With the enactment of changes to the functional currency tax legislation by the Government of Canada in the
first quarter of fiscal 2010, the Company changed the basis for calculating its income tax provision for its
Canadian operations from Canadian dollars to the U.S. dollar, its reporting currency, with the effective date
being the beginning of fiscal 2009. Gains realized on the revaluation of these tax liabilities previously
denominated in Canadian dollars throughout 2009 were reversed upon enactment of the changes to the rules
in the first quarter of fiscal 2010. Included in the total selling, marketing and administration for fiscal 2010 is a
$54.3 million charge primarily relating to the reversal of foreign exchange gains previously recorded in fiscal
2009 on the revaluation of Canadian dollar denominated tax liability balances. Throughout fiscal 2009,
foreign exchange gains were offset by foreign exchange losses incurred as a part of the Company’s foreign
currency hedging program. See “Income Taxes” for the fiscal year ended February 27, 2010 for further details
on the changes to the functional currency tax legislation in Canada, and “Market Risk of Financial
Instruments — Foreign Exchange” for additional information on the Company’s hedging instruments.
Selling, marketing and administration expenses for fiscal 2010 also included a charge of $42.1 million for the
payment on account of certain employee tax liabilities related to certain previously-exercised stock options
with measurement date issues that were exercised during certain time periods. The Company’s Board of
Directors approved the payment on account of certain incremental personal tax liabilities of certain
employees, excluding RIM’s Co-CEOs, related to the exercise of certain stock options issued by the Company.
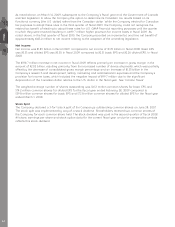
Amortization Expense
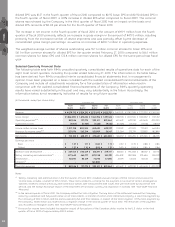
The table below presents a comparison of amortization expense relating to capital assets and intangible
assets recorded as amortization or cost of sales for fiscal 2010 compared to fiscal 2009. Intangible assets are
comprised of patents, licenses and acquired technology.
(in thousands)
February 27,
2010
February 28,
2009 Change
February 27,
2010
February 28,
2009 Change
Included in Amortization Included in Cost of sales
For the Fiscal Year Ended
Capital assets................ $184,946 $ 119,209 $ 65,737 $ 159,540 $ 84,168 $ 75,372
Intangible assets ........... 125,411 75,594 49,817 145,724 48,925 96,799
Total.............................. $ 310,357 $194,803 $115,554 $305,264 $133,093 $172,171
MD&A
19