Blackberry 2010 Annual Report Download - page 77
Download and view the complete annual report
Please find page 77 of the 2010 Blackberry annual report below. You can navigate through the pages in the report by either clicking on the pages listed below, or by using the keyword search tool below to find specific information within the annual report.-
 1
1 -
2
-
3
-
4
-
5
-
6
-
7
-
8
-
9
-
10
-
11
-
12
-
13
-
14
-
15
-
16
-
17
-
18
-
19
-
20
-
21
-
22
-
23
-
24
-
25
-
26
-
27
-
28
-
29
-
30
-
31
-
32
-
33
-
34
-
35
-
36
-
37
-
38
-
39
-
40
-
41
-
42
-
43
-
44
-
45
-
46
-
47
-
48
-
49
-
50
-
51
-
52
-
53
-
54
-
55
-
56
-
57
-
58
-
59
-
60
-
61
-
62
-
63
-
64
-
65
-
66
-
 67
67 -
 68
68 -
 69
69 -
 70
70 -
 71
71 -
 72
72 -
 73
73 -
 74
74 -
 75
75 -
 76
76 -
 77
77 -
 78
78 -
 79
79 -
 80
80 -
 81
81 -
 82
82 -
 83
83 -
 84
84 -
 85
85 -
 86
86 -
 87
87 -
88
-
89
-
90
-
91
-
92
-
93
-
94
-
95
-
96
-
97
-
98
 |
 |

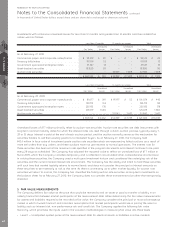
• Level 2 — Observable inputs other than quoted prices included in Level 1, such as quoted prices for similar assets and
liabilities in active markets; quoted prices for identical or similar assets and liabilities in markets that are not active; or
other inputs that are observable or can be corroborated by observable market data.
• Level 3 — Significant unobservable inputs which are supported by little or no market activity.
The fair value hierarchy also requires the Company to maximize the use of observable inputs and minimize the use of
unobservable inputs when measuring fair value.
The carrying amounts of the Company’s cash and cash equivalents, accounts receivable, other receivables, accounts
payable and accrued liabilities, approximate fair value due to their short maturities. When determining the fair value of its
investments held, the Company primarily relies on an independent third party valuator for the fair valuation of securities.
Pricing inputs by the service provider are generally received from two primary vendors. The pricing inputs are reviewed for
completeness, tolerance and accuracy on a daily basis by the service provider. The Company also reviews and
understands the inputs used in the valuation process and assesses the pricing of the securities for reasonableness. To do
this, the Company utilizes internally developed models to estimate fair value. Inputs into the internally developed models
may include benchmark yields, reported trades, quotes, issuer spreads, benchmark curves (including Treasury
benchmarks, LIBOR and swap curves), discount rates, derivative indices, recovery and default rates, prepayment rates,
trustee reports, bids/offers and other reference data. In the event the Company disagrees with the pricing from the service
provider, the Company will challenge the pricing and work with the service provider to determine the most reasonable fair
value.
The fair value of currency forward contracts has been estimated using market quoted currency spot rates and interest
rates. The estimates presented herein are not necessarily indicative of the amounts that the Company could realize in a
current market exchange. Changes in assumptions could have a significant effect on the estimates.
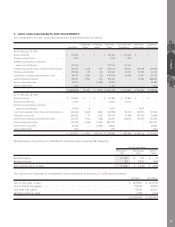
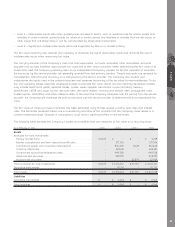
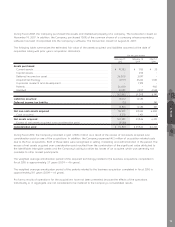
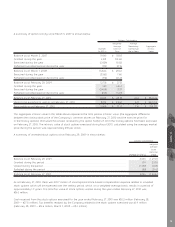
The following table presents the Company’s assets and liabilities that are measured at fair value on a recurring basis:
As at February 27, 2010 Level 1 Level 2 Level 3 Total
Assets
Available-for-sale investments
Money market fund..................................................................... $ 3,278 $ – $ – $ 3,278
Banker acceptances and term deposits/certificates ..................... – 377,596 – 377,596
Commerical paper and corporate notes/bonds ........................... – 846,496 15,128 861,624
Treasury bills/notes ..................................................................... – 203,631 – 203,631
Government sponsored enterprise notes ...................................... – 449,708 – 449,708
Asset-backed securities ............................................................... – 398,981 – 398,981
Auction-rate securities.................................................................. – – 32,839 32,839
Total available-for-sale investments ................................................ $ 3,278 $ 2,276,412 $ 47,967 $ 2,327,657
Derivative instruments..................................................................... – 97,261 – 97,261
Total assets .................................................................................... $ 3,278 $ 2,373,673 $ 47,967 $ 2,424,918
Liabilities
Derivative instruments..................................................................... $ – $ 6,164 $ – $ 6,164
Total liabilities................................................................................. $ – $ 6,164 $ – $ 6,164
NOTE 5
69