Blackberry 2010 Annual Report Download - page 9
Download and view the complete annual report
Please find page 9 of the 2010 Blackberry annual report below. You can navigate through the pages in the report by either clicking on the pages listed below, or by using the keyword search tool below to find specific information within the annual report.-
 1
1 -
 2
2 -
 3
3 -
 4
4 -
 5
5 -
 6
6 -
 7
7 -
 8
8 -
 9
9 -
 10
10 -
 11
11 -
 12
12 -
 13
13 -
 14
14 -
 15
15 -
 16
16 -
 17
17 -
 18
18 -
 19
19 -
 20
20 -
21
-
22
-
23
-
24
-
25
-
26
-
27
-
28
-
29
-
30
-
31
-
32
-
33
-
34
-
35
-
36
-
37
-
38
-
39
-
40
-
41
-
42
-
43
-
44
-
45
-
46
-
47
-
48
-
49
-
50
-
51
-
52
-
53
-
54
-
55
-
56
-
57
-
58
-
59
-
60
-
61
-
62
-
63
-
64
-
65
-
66
-
67
-
68
-
69
-
70
-
71
-
72
-
73
-
74
-
75
-
76
-
77
-
78
-
79
-
80
-
81
-
82
-
83
-
84
-
85
-
86
-
87
-
88
-
89
-
90
-
91
-
92
-
93
-
94
-
95
-
96
-
97
-
98
 |
 |
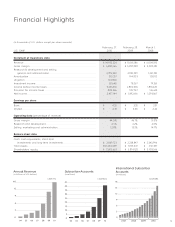
Financial Highlights
(in thousands of U.S. dollars, except per share amounts)
U.S. GAAP
February 27,
2010
February 28,
2009
March 1,
2008
Statement of Operations data
Revenue............................................................................................... $ 14,953,224 $ 11,065,186 $ 6,009,395
Gross margin....................................................................................... $ 6,584,266 $ 5,097,298 $ 3,080,581
Research & development and selling,
general and administration ............................................................. 2,872,239 2,180,399 1,241,310
Amortization ........................................................................................ 310,357 194,803 108,112
Litigation ............................................................................................. 163,800 – –
Investment income ............................................................................... 28,640 78,267 79,361
Income before income taxes ................................................................ 3,266,510 2,800,363 1,810,520
Provision for income taxes ................................................................... 809,366 907,747 516,653
Net income .......................................................................................... 2,457,144 $ 1,892,616 $ 1,293,867
Earnings per share
Basic ................................................................................................... $ 4.35 $ 3.35 $ 2.31
Diluted................................................................................................. $ 4.31 $ 3.30 $ 2.26
Operating data (percentage of revenue)
Gross margin....................................................................................... 44.0% 46.1% 51.3%
Research and development ................................................................. 6.5% 6.2% 6.0%
Selling, marketing and administration .................................................. 12.8% 13.5% 14.7%
Balance sheet data
Cash, cash equivalents, short-term
investments and long-term investments ........................................... $ 2,869,723 $ 2,238,847 $ 2,343,996
Total assets ......................................................................................... $10,204,409 $ 8,101,372 $ 5,511,187
Shareholders’ equity ............................................................................ $ 7,602,663 $ 5,874,128 $ 3,933,566
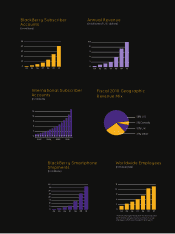
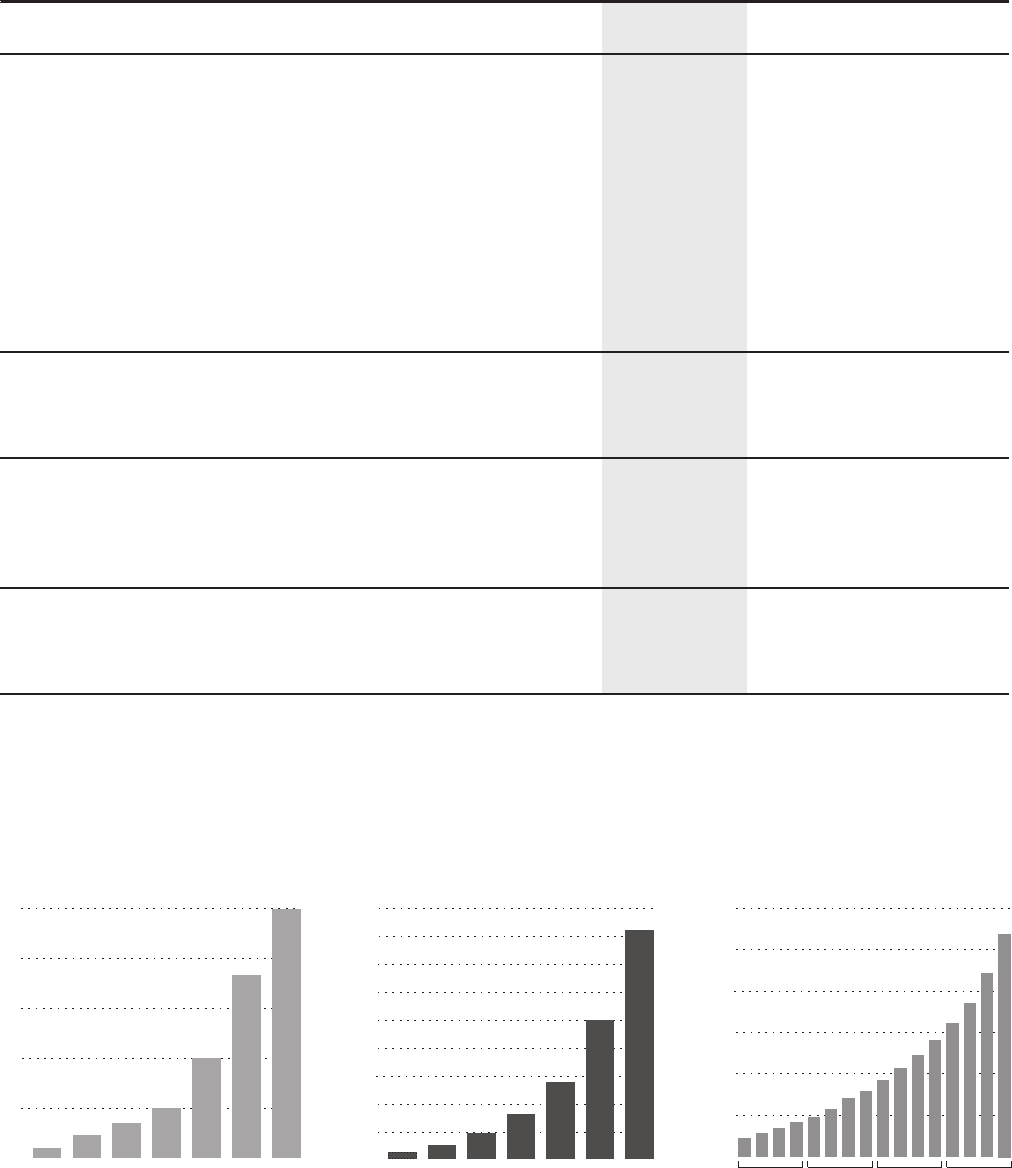
International Subscriber
Accounts
(in millions)
0
3
6
9
12
$15
10090807060504
Annual Revenue
(in billions of U.S. dollars)
0
5
10
15
20
25
30
35
40
45
10090807060504
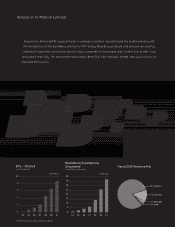
Subscriber Accounts
(in millions)
CAGR 84% CAGR 88%CAGR 71%
0
3
6
9
12
18
15
Q4
Q2
Q1
Q4
Q3
Q2
Q1
Q4
Q3
Q2
Q1
Q4
Q3
Q2
Q1
2007 2008 2009 2010
Q3
1