Blackberry 2010 Annual Report Download - page 36
Download and view the complete annual report
Please find page 36 of the 2010 Blackberry annual report below. You can navigate through the pages in the report by either clicking on the pages listed below, or by using the keyword search tool below to find specific information within the annual report.-
 1
1 -
2
-
3
-
4
-
5
-
6
-
7
-
8
-
9
-
10
-
11
-
12
-
13
-
14
-
15
-
16
-
17
-
18
-
19
-
20
-
21
-
22
-
23
-
24
-
25
-
 26
26 -
 27
27 -
 28
28 -
 29
29 -
 30
30 -
 31
31 -
 32
32 -
 33
33 -
 34
34 -
 35
35 -
 36
36 -
 37
37 -
 38
38 -
 39
39 -
 40
40 -
 41
41 -
 42
42 -
 43
43 -
 44
44 -
 45
45 -
 46
46 -
47
-
48
-
49
-
50
-
51
-
52
-
53
-
54
-
55
-
56
-
57
-
58
-
59
-
60
-
61
-
62
-
63
-
64
-
65
-
66
-
67
-
68
-
69
-
70
-
71
-
72
-
73
-
74
-
75
-
76
-
77
-
78
-
79
-
80
-
81
-
82
-
83
-
84
-
85
-
86
-
87
-
88
-
89
-
90
-
91
-
92
-
93
-
94
-
95
-
96
-
97
-
98
 |
 |

diluted EPS was $1.27 in the fourth quarter of fiscal 2010 compared to $0.92 basic EPS and $0.90 diluted EPS in
the fourth quarter of fiscal 2009, a 41.1% increase in diluted EPS when compared to fiscal 2009. The common
shares repurchased by the Company in the third quarter of fiscal 2010 had an impact on the basic and
diluted EPS amounts of $0.03 per share for the fourth quarter of fiscal 2010.
The increase in net income in the fourth quarter of fiscal 2010 in the amount of $191.9 million from the fourth
quarter of fiscal 2009 primarily reflects an increase in gross margin in the amount of $479.5 million, resulting
primarily from the increased number of device shipments and was partially offset by the decrease of
consolidated gross margin percentage, as well as an increase of $200.7 million in operating expenses.
The weighted average number of shares outstanding was 557.1 million common shares for basic EPS and
561.1 million common shares for diluted EPS for the quarter ended February 27, 2010 compared to 566.1 million
common shares for basic EPS and 572.8 million common shares for diluted EPS for the same period last fiscal
year.
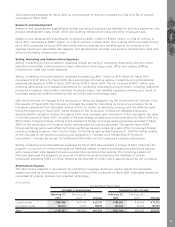
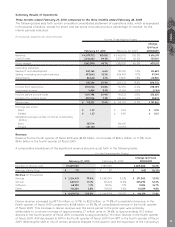
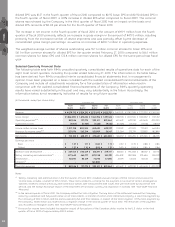
Selected Quarterly Financial Data
The following table sets forth RIM’s unaudited quarterly consolidated results of operations data for each of the
eight most recent quarters, including the quarter ended February 27, 2010. The information in the table below
has been derived from RIM’s unaudited interim consolidated financial statements that, in management’s
opinion, have been prepared on a basis consistent with the audited consolidated financial statements of the
Company and include all adjustments necessary for a fair presentation of information when read in
conjunction with the audited consolidated financial statements of the Company. RIM’s quarterly operating
results have varied substantially in the past and may vary substantially in the future. Accordingly, the
information below is not necessarily indicative of results for any future quarter.
(in thousands, except per share data)
Fourth
Quarter
Third
Quarter
Second
Quarter
First
Quarter
Fourth
Quarter
Third
Quarter
Second
Quarter
First
Quarter
Fiscal Year 2010 Fiscal Year 2009
Revenue ............................................................... $ 4,079,712 $ 3,924,310 $ 3,525,692 $ 3,423,510 $ 3,463,193 $ 2,782,098 $ 2,577,330 $ 2,242,565
Gross margin ....................................................... $ 1,863,090 $ 1,675,255 $ 1,554,396 $ 1,491,525 $ 1,383,578 $ 1,269,506 $ 1,306,857 $ 1,137,357
Operating expenses
(1)(2)
......................................... 851,346 791,175 902,411 801,464 650,623 629,035 604,624 490,920
Investment income ............................................... (5,454) (6,425) (7,625) (9,136) (10,568) (31,554) (17,168) (18,977)
Income before income taxes ................................ 1,017,198 890,505 659,610 699,197 743,523 672,025 719,401 665,414
Provision for income taxes
(1)(3)
............................... 307,076 262,134 183,989 56,167 225,264 275,729 223,855 182,899
Net income........................................................... $ 710,122 $ 628,371 $ 475,621 $ 643,030 $ 518,259 $ 396,296 $ 495,546 $ 482,515
Earnings per share
Basic................................................................ $ 1.27 $ 1.11 $ 0.84 $ 1.13 $ 0.92 $ 0.70 $ 0.88 $ 0.86
Diluted.............................................................. $ 1.27 $ 1.10 $ 0.83 $ 1.12 $ 0.90 $ 0.69 $ 0.86 $ 0.84
Research and development.................................. $ 267,164 $ 242,329 $ 235,571 $ 219,777 $ 182,535 $ 193,044 $ 181,347 $ 127,776
Selling, marketing and administration
(1)
................ 497,642 465,717 429,748 514,291 406,493 382,968 379,644 326,592
Amortization ......................................................... 86,540 83,129 73,292 67,396 61,595 53,023 43,633 36,552
Litigation
(2)
............................................................ – – 163,800 – ––––
Operating expenses ............................................. $ 851,346 $ 791,175 $ 902,411 $ 801,464 $ 650,623 $ 629,035 $ 604,624 $ 490,920
Notes:
(1)
Selling, marketing and administration in the first quarter of fiscal 2010 included unusual charges of $96.4 million and provision for
income taxes includes a benefit of $175.1 million. These items related to a charge for the payment on account of certain employee tax
liabilities related to certain previously exercised stock options with measurement date issues that were exercised during certain time
periods and the foreign exchange impact of the enactment of functional currency tax legislation in Canada. See “Non-GAAP Financial
Measures”.
(2)
In the second quarter of fiscal 2010, the Company settled the Visto Litigation. The key terms of the settlement involved the Company
receiving a perpetual and fully-paid license on all Visto patents, a transfer of certain Visto intellectual property, a one-time payment by
the Company of $267.5 million and the parties executing full and final releases in respect of the Visto Litigation. Of the total payment by
the Company, $163.8 million was expensed as a litigation charge in the second quarter of fiscal 2010. The remainder of the payment
was recorded as intangible assets. See “Non-GAAP Financial Measures”.
(3)
Provision for income taxes included the negative impact of fluctuations of the Canadian dollar relative to the U.S. dollar in the third
quarter of fiscal 2009 of approximately $103.2 million.
MD&A
28