Blackberry 2010 Annual Report Download - page 15
Download and view the complete annual report
Please find page 15 of the 2010 Blackberry annual report below. You can navigate through the pages in the report by either clicking on the pages listed below, or by using the keyword search tool below to find specific information within the annual report.-
 1
1 -
2
-
3
-
4
-
 5
5 -
 6
6 -
 7
7 -
 8
8 -
 9
9 -
 10
10 -
 11
11 -
 12
12 -
 13
13 -
 14
14 -
 15
15 -
 16
16 -
 17
17 -
 18
18 -
 19
19 -
 20
20 -
 21
21 -
 22
22 -
 23
23 -
 24
24 -
 25
25 -
26
-
27
-
28
-
29
-
30
-
31
-
32
-
33
-
34
-
35
-
36
-
37
-
38
-
39
-
40
-
41
-
42
-
43
-
44
-
45
-
46
-
47
-
48
-
49
-
50
-
51
-
52
-
53
-
54
-
55
-
56
-
57
-
58
-
59
-
60
-
61
-
62
-
63
-
64
-
65
-
66
-
67
-
68
-
69
-
70
-
71
-
72
-
73
-
74
-
75
-
76
-
77
-
78
-
79
-
80
-
81
-
82
-
83
-
84
-
85
-
86
-
87
-
88
-
89
-
90
-
91
-
92
-
93
-
94
-
95
-
96
-
97
-
98
 |
 |

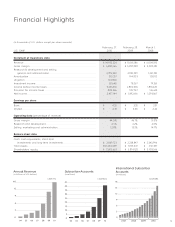
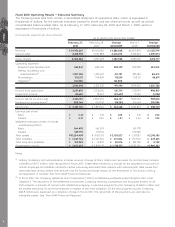
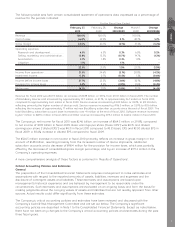
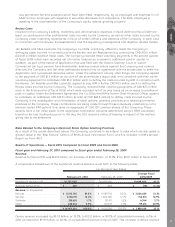
The following table sets forth certain consolidated statement of operations data expressed as a percentage of
revenue for the periods indicated:
February 27,
2010
February 28,
2009
Change
2010/2009
March 1,
2008
Change
2009/2008
For the Fiscal Year Ended
Revenue .................................................. 100.0% 100.0% –100.0% –
Cost of sales ........................................... 56.0% 53.9% 2.1% 48.7% 5.2%
Gross margin .......................................... 44.0% 46.1% (2.1%) 51.3% (5.2%)
Operating expenses
Research and development .................. 6.5% 6.2% 0.3% 6.0% 0.2%
Selling, marketing and administration .. 12.8% 13.5% (0.7%) 14.7% (1.2%)
Amortization ......................................... 2.1% 1.8% 0.3% 1.8% –
Litigation.............................................. 1.1% –1.1% ––
22.5% 21.5% 1.0% 22.5% (1.0%)
Income from operations .......................... 21.5% 24.6% (3.1%) 28.8% (4.2%)
Investment income................................... 0.2% 0.7% (0.5%) 1.3% (0.6%)
Income before income taxes.................... 21.7% 25.3% (3.6%) 30.1% (4.8%)
Provision for income taxes ....................... 5.4% 8.2% (2.8%) 8.6% (0.4%)
Net income.............................................. 16.3% 17.1% (0.8%) 21.5% (4.4%)
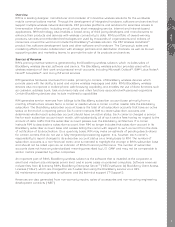
Revenue for fiscal 2010 was $14.95 billion, an increase of $3.88 billion, or 35.1%, from $11.07 billion in fiscal 2009. The number
of BlackBerry devices sold increased by approximately 10.7 million, or 41.1%, to approximately 36.7 million in fiscal 2010,
compared to approximately 26.0 million in fiscal 2009. Device revenue increased by $3.03 billion, or 33.3%, to $12.12 billion,
reflecting primarily the higher number of devices sold. Service revenue increased by $756.0 million, or 53.9% to $2.16 billion,
reflecting the increase of approximately 17 million net new BlackBerry subscriber accounts since the end of fiscal 2009. The
total BlackBerry subscriber account base increased to over 41 million at the end of fiscal 2010. Software revenue increased
by $6.7 million to $258.6 million in fiscal 2010 and Other revenue increased by $99.2 million to $420.2 million in fiscal 2010.
The Company’s net income for fiscal 2010 was $2.46 billion, an increase of $564.5 million, or 29.8%, compared
to net income of $1.89 billion in fiscal 2009. Basic earnings per share (“basic EPS”) was $4.35 and diluted
earnings per share (“diluted EPS”) was $4.31 in fiscal 2010 compared to $3.35 basic EPS and $3.30 diluted EPS in
fiscal 2009, a 30.6% increase in diluted EPS compared to fiscal 2009.
The $564.5 million increase in net income in fiscal 2010 primarily reflects an increase in gross margin in the
amount of $1.48 billion, resulting primarily from the increased number of device shipments, additional
subscriber accounts and a decrease of $98.4 million for the provision for income taxes, which was partially
offset by the decrease of consolidated gross margin percentage, and by an increase of $971.2 million in the
Company’s operating expenses.
A more comprehensive analysis of these factors is contained in “Results of Operations”.
Critical Accounting Policies and Estimates
General
The preparation of the Consolidated Financial Statements requires management to make estimates and
assumptions with respect to the reported amounts of assets, liabilities, revenues and expenses and the
disclosure of contingent assets and liabilities. These estimates and assumptions are based upon
management’s historical experience and are believed by management to be reasonable under the
circumstances. Such estimates and assumptions are evaluated on an ongoing basis and form the basis for
making judgments about the carrying values of assets and liabilities that are not readily apparent from other
sources. Actual results could differ significantly from these estimates.
The Company’s critical accounting policies and estimates have been reviewed and discussed with the
Company’s Audit & Risk Management Committee and are set out below. The Company’s significant
accounting policies are described in Note 1 to the Consolidated Financial Statements. Except as noted below,
there have not been any changes to the Company’s critical accounting policies and estimates during the past
three fiscal years.
MD&A
7