Blackberry 2010 Annual Report Download - page 33
Download and view the complete annual report
Please find page 33 of the 2010 Blackberry annual report below. You can navigate through the pages in the report by either clicking on the pages listed below, or by using the keyword search tool below to find specific information within the annual report.-
 1
1 -
2
-
3
-
4
-
5
-
6
-
7
-
8
-
9
-
10
-
11
-
12
-
13
-
14
-
15
-
16
-
17
-
18
-
19
-
20
-
21
-
22
-
 23
23 -
 24
24 -
 25
25 -
 26
26 -
 27
27 -
 28
28 -
 29
29 -
 30
30 -
 31
31 -
 32
32 -
 33
33 -
 34
34 -
 35
35 -
 36
36 -
 37
37 -
 38
38 -
 39
39 -
 40
40 -
 41
41 -
 42
42 -
 43
43 -
44
-
45
-
46
-
47
-
48
-
49
-
50
-
51
-
52
-
53
-
54
-
55
-
56
-
57
-
58
-
59
-
60
-
61
-
62
-
63
-
64
-
65
-
66
-
67
-
68
-
69
-
70
-
71
-
72
-
73
-
74
-
75
-
76
-
77
-
78
-
79
-
80
-
81
-
82
-
83
-
84
-
85
-
86
-
87
-
88
-
89
-
90
-
91
-
92
-
93
-
94
-
95
-
96
-
97
-
98
 |
 |

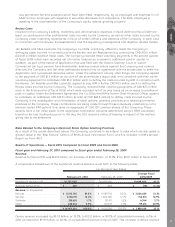
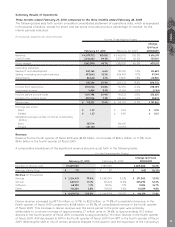
Summary Results of Operations
Three months ended February 27, 2010 compared to the three months ended February 28, 2009
The following table sets forth certain unaudited consolidated statement of operations data, which is expressed
in thousands of dollars, except for share and per share amounts and as a percentage of revenue, for the
interim periods indicated.
(in thousands, except for per share amounts)
February 27, 2010 February 28, 2009
Change
Q4 Fiscal
2010/2009
For the Three Months Ended
Revenue.................................................................... $ 4,079,712 100.0% $ 3,463,193 100.0% $ 616,519
Cost of sales............................................................. 2,216,622 54.3% 2,079,615 60.0% 137,007
Gross margin............................................................ 1,863,090 45.7% 1,383,578 40.0% 479,512
Operating expenses
Research and development....................................... 267,164 6.6% 182,535 5.3% 84,629
Selling, marketing and administration ....................... 497,642 12.2% 406,493 11.7% 91,149
Amortization ............................................................. 86,540 2.1% 61,595 1.8% 24,945
851,346 20.9% 650,623 18.8% 200,723
Income from operations ............................................ 1,011,744 24.8% 732,955 21.2% 278,789
Investment income .................................................... 5,454 0.1% 10,568 0.3% (5,114)
Income before income taxes ..................................... 1,017,198 24.9% 743,523 21.5% 273,675
Provision for income taxes ........................................ 307,076 7.5% 225,264 6.5% 81,812
Net income ............................................................... $ 710,122 17.4% $ 518,259 15.0% $ 191,863
Earnings per share
Basic..................................................................... $ 1.27 $ 0.92 $ 0.35
Diluted .................................................................. $ 1.27 $ 0.90 $ 0.37
Weighted-average number of shares outstanding
(000’s)
Basic..................................................................... 557,114 566,105
Diluted .................................................................. 561,130 572,753
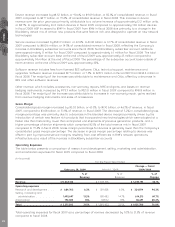
Revenue
Revenue for the fourth quarter of fiscal 2010 was $4.08 billion, an increase of $616.5 million, or 17.8%, from
$3.46 billion in the fourth quarter of fiscal 2009.
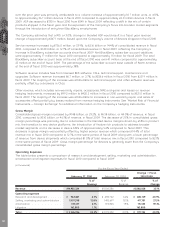
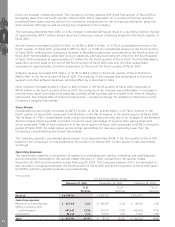
A comparative breakdown of the significant revenue streams is set forth in the following table:
February 27, 2010 February 28, 2009
Change Q4 Fiscal
2010/2009
For the Three Months Ended
Number of devices sold .................... 10,469,000 7,780,000 2,689,000 34.6%
Average Selling Price ........................ $ 311 $ 371 $ (60) (16.2%)
Revenue (in thousands)
Devices............................................. $ 3,254,401 79.8% $ 2,883,399 83.3% $ 371,002 12.9%
Service ............................................. 640,517 15.7% 415,223 12.0% 225,294 54.3%
Software........................................... 68,590 1.7% 58,756 1.7% 9,834 16.7%
Other................................................ 116,204 2.8% 105,815 3.0% 10,389 9.8%
$ 4,079,712 100.0% $ 3,463,193 100.0% $ 616,519 17.8%
Device revenue increased by $371.0 million, or 12.9%, to $3.25 billion, or 79.8% of consolidated revenue, in the
fourth quarter of fiscal 2010 compared to $2.88 billion, or 83.3%, of consolidated revenue in the fourth quarter
of fiscal 2009. This increase in device revenue over the same period in the prior year was primarily
attributable to a volume increase of approximately 2.7 million units, or 34.6%, to approximately 10.5 million
devices in the fourth quarter of fiscal 2010 compared to approximately 7.8 million devices in the fourth quarter
of fiscal 2009. ASP decreased to $311 in the fourth quarter of fiscal 2010 from $371 in the fourth quarter of fiscal
2009 reflecting the shift in mix of certain products shipped in the quarter and the expansion of the Company’s
MD&A
25