Blackberry 2010 Annual Report Download - page 14
Download and view the complete annual report
Please find page 14 of the 2010 Blackberry annual report below. You can navigate through the pages in the report by either clicking on the pages listed below, or by using the keyword search tool below to find specific information within the annual report.-
 1
1 -
2
-
3
-
 4
4 -
 5
5 -
 6
6 -
 7
7 -
 8
8 -
 9
9 -
 10
10 -
 11
11 -
 12
12 -
 13
13 -
 14
14 -
 15
15 -
 16
16 -
 17
17 -
 18
18 -
 19
19 -
 20
20 -
 21
21 -
 22
22 -
 23
23 -
 24
24 -
25
-
26
-
27
-
28
-
29
-
30
-
31
-
32
-
33
-
34
-
35
-
36
-
37
-
38
-
39
-
40
-
41
-
42
-
43
-
44
-
45
-
46
-
47
-
48
-
49
-
50
-
51
-
52
-
53
-
54
-
55
-
56
-
57
-
58
-
59
-
60
-
61
-
62
-
63
-
64
-
65
-
66
-
67
-
68
-
69
-
70
-
71
-
72
-
73
-
74
-
75
-
76
-
77
-
78
-
79
-
80
-
81
-
82
-
83
-
84
-
85
-
86
-
87
-
88
-
89
-
90
-
91
-
92
-
93
-
94
-
95
-
96
-
97
-
98
 |
 |
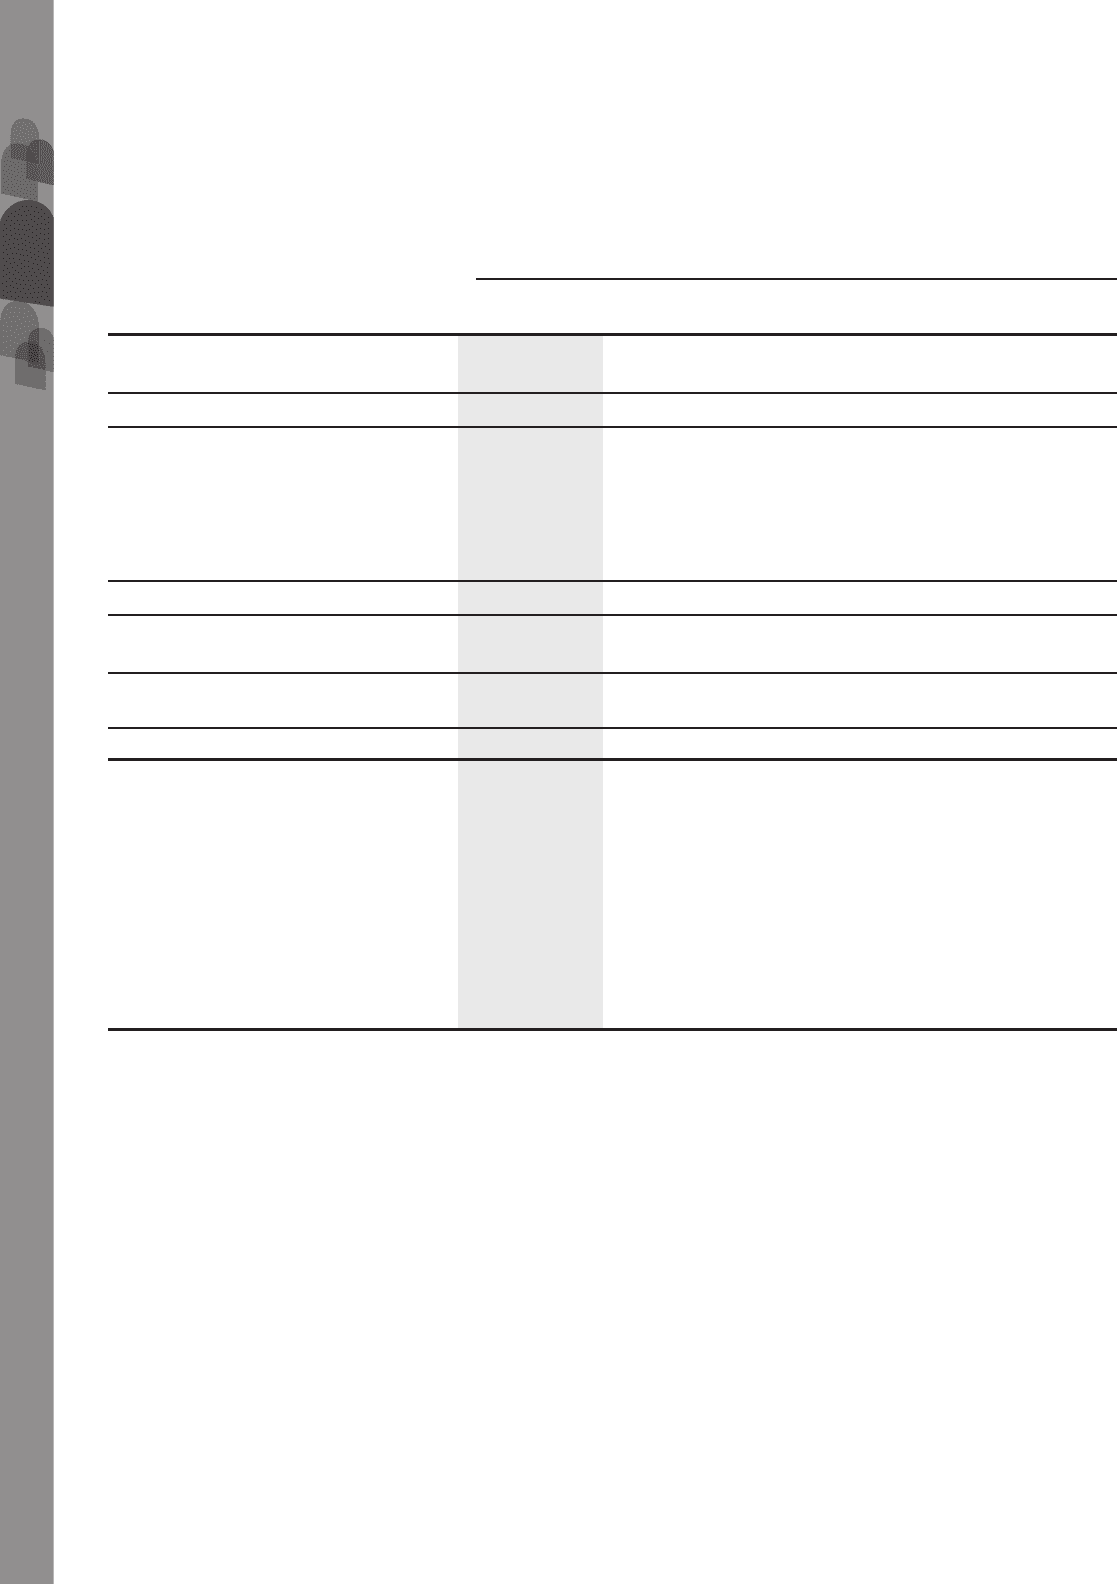
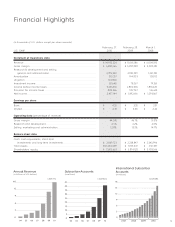
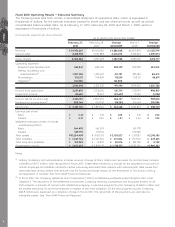
Fiscal 2010 Operating Results — Executive Summary
The following table sets forth certain consolidated statement of operations data, which is expressed in
thousands of dollars, for the periods indicated, except for share and per share amounts, as well as certain
consolidated balance sheet data, as at February 27, 2010, February 28, 2009 and March 1, 2008, which is
expressed in thousands of dollars.
(in thousands, except for per share amounts)
February 27,
2010
February 28,
2009
Change
2010/2009
March 1,
2008
Change
2009/2008
As at and for the Fiscal Year Ended
Revenue ............................................... $ 14,953,224 $11,065,186 $ 3,888,038 $6,009,395 $ 5,055,791
Cost of sales ........................................ 8,368,958 5,967,888 2,401,070 2,928,814 3,039,074
Gross margin ....................................... 6,584,266 5,097,298 1,486,968 3,080,581 2,016,717
Operating expenses
Research and development ............... 964,841 684,702 280,139 359,828 324,874
Selling, marketing and
administration
(1)
............................. 1,907,398 1,495,697 411,701 881,482 614,215
Amortization ...................................... 310,357 194,803 115,554 108,112 86,691
Litigation
(2)
........................................ 163,800 –163,800 ––
3,346,396 2,375,202 971,194 1,349,422 1,025,780
Income from operations........................ 3,237,870 2,722,096 515,774 1,731,159 990,937
Investment income................................ 28,640 78,267 (49,627) 79,361 (1,094)
Income before income taxes ................. 3,266,510 2,800,363 466,147 1,810,520 989,843
Provision for income taxes
(1)
.................. 809,366 907,747 (98,381) 516,653 391,094
Net income........................................... $ 2,457,144 $ 1,892,616 $ 564,528 $ 1,293,867 $ 598,749
Earnings per share
Basic................................................. $ 4.35 $ 3.35 $ 1.00 $ 2.31 $ 1.04
Diluted .............................................. $ 4.31 $ 3.30 $ 1.01 $ 2.26 $ 1.04
Weighted-average number of shares
outstanding (000’s)
Basic................................................. 564,492 565,059 559,778
Diluted .............................................. 569,759 574,156 572,830
Total assets.......................................... $10,204,409 $ 8,101,372 $ 2,103,037 $ 5,511,187 $ 2,590,185
Total liabilities ...................................... $ 2,601,746 $ 2,227,244 $ 374,502 $ 1,577,621 $ 649,623
Total long-term liabilities ....................... $ 169,969 $ 111,893 $ 58,076 $ 103,190 $ 8,703
Shareholders’ equity ............................. $ 7,602,663 $ 5,874,128 $ 1,728,535 $ 3,933,566 $1,940,562
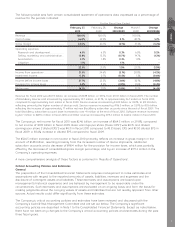
Notes:
(1)
Selling, marketing and administration includes unusual charges of $96.4 million and provision for income taxes includes
a benefit of $175.1 million, both recognized in fiscal 2010. These items related to a charge for the payment on account of
certain employee tax liabilities related to certain previously exercised stock options with measurement date issues that
were exercised during certain time periods and the foreign exchange impact of the enactment of functional currency
tax legislation in Canada. See “Non-GAAP Financial Measures”.
(2)
In fiscal 2010, the Company settled all Visto Corporation (“Visto”) outstanding worldwide patent litigation (the “Visto
Litigation”). The key terms of the settlement involved the Company receiving a perpetual and fully-paid license on all
Visto patents, a transfer of certain Visto intellectual property, a one-time payment by the Company of $267.5 million and
the parties executing full and final releases in respect of the Visto Litigation. Of the total payment by the Company,
$163.8 million was expensed as a litigation charge in fiscal 2010. The remainder of the payment was recorded as
intangible assets. See “Non-GAAP Financial Measures”.
MD&A
6