Blackberry 2010 Annual Report Download - page 65
Download and view the complete annual report
Please find page 65 of the 2010 Blackberry annual report below. You can navigate through the pages in the report by either clicking on the pages listed below, or by using the keyword search tool below to find specific information within the annual report.-
 1
1 -
2
-
3
-
4
-
5
-
6
-
7
-
8
-
9
-
10
-
11
-
12
-
13
-
14
-
15
-
16
-
17
-
18
-
19
-
20
-
21
-
22
-
23
-
24
-
25
-
26
-
27
-
28
-
29
-
30
-
31
-
32
-
33
-
34
-
35
-
36
-
37
-
38
-
39
-
40
-
41
-
42
-
43
-
44
-
45
-
46
-
47
-
48
-
49
-
50
-
51
-
52
-
53
-
54
-
 55
55 -
 56
56 -
 57
57 -
 58
58 -
 59
59 -
 60
60 -
 61
61 -
 62
62 -
 63
63 -
 64
64 -
 65
65 -
 66
66 -
 67
67 -
 68
68 -
 69
69 -
 70
70 -
 71
71 -
 72
72 -
 73
73 -
 74
74 -
 75
75 -
76
-
77
-
78
-
79
-
80
-
81
-
82
-
83
-
84
-
85
-
86
-
87
-
88
-
89
-
90
-
91
-
92
-
93
-
94
-
95
-
96
-
97
-
98
 |
 |

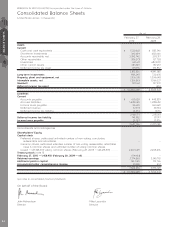
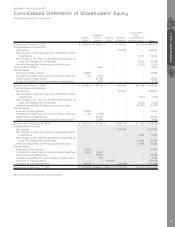
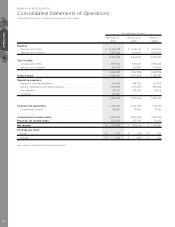
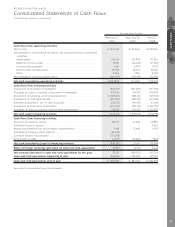
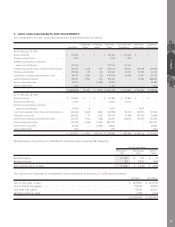
RESEARCH IN MOTION LIMITED
Consolidated Statements of Cash Flows
(United States dollars, in thousands)
February 27,
2010
February 28,
2009
March 1,
2008
For the Year Ended
Cash flows from operating activities
Net income ............................................................................................. $ 2,457,144 $ 1,892,616 $ 1,293,867
Adjustments to reconcile net income to net cash provided by operating
activities:
Amortization ........................................................................................ 615,621 327,896 177,366
Deferred income taxes......................................................................... 51,363 (36,623) (67,244)
Income taxes payable ......................................................................... 4,611 (6,897) 4,973
Stock-based compensation ................................................................. 58,038 38,100 33,700
Other................................................................................................... 8,806 5,867 3,303
Net changes in working capital items...................................................... (160,709) (769,114) 130,794
Net cash provided by operating activities ............................................. 3,034,874 1,451,845 1,576,759
Cash flows from investing activities
Acquisition of long-term investments ....................................................... (862,977) (507,082) (757,656)
Proceeds on sale or maturity of long-term investments ........................... 473,476 431,713 260,393
Acquisition of property, plant and equipment .......................................... (1,009,416) (833,521) (351,914)
Acquisition of intangible assets ............................................................... (421,400) (687,913) (374,128)
Business acquisitions, net of cash acquired ............................................. (143,375) (48,425) (6,200)
Acquisition of short-term investments ...................................................... (476,956) (917,316) (1,249,919)
Proceeds on sale or maturity of short-term investments .......................... 970,521 739,021 1,325,487
Net cash used in investing activities....................................................... (1,470,127) (1,823,523) (1,153,937)
Cash flows from financing activities
Issuance of common shares ................................................................... 30,246 27,024 62,889
Additional paid-in capital ........................................................................ – – 9,626
Excess tax benefits from stock-based compensation ............................... 1,943 12,648 8,185
Purchase of treasury stock (note 11)......................................................... (94,463) – –
Common shares repurchased ................................................................. (775,008) – –
Repayment of debt ................................................................................. (6,099) (14,305) (302)
Net cash provided by (used in) financing activities ................................ (843,381) 25,367 80,398
Effect of foreign exchange gain (loss) on cash and cash equivalents .... (6,051) (2,541) 4,034
Net increase (decrease) in cash and cash equivalents for the year........ 715,315 (348,852) 507,254
Cash and cash equivalents, beginning of year....................................... 835,546 1,184,398 677,144
Cash and cash equivalents, end of year ................................................ $ 1,550,861 $ 835,546 $ 1,184,398
See notes to consolidated financial statements
CASH FLOWS
57