Blackberry 2010 Annual Report Download - page 78
Download and view the complete annual report
Please find page 78 of the 2010 Blackberry annual report below. You can navigate through the pages in the report by either clicking on the pages listed below, or by using the keyword search tool below to find specific information within the annual report.-
 1
1 -
2
-
3
-
4
-
5
-
6
-
7
-
8
-
9
-
10
-
11
-
12
-
13
-
14
-
15
-
16
-
17
-
18
-
19
-
20
-
21
-
22
-
23
-
24
-
25
-
26
-
27
-
28
-
29
-
30
-
31
-
32
-
33
-
34
-
35
-
36
-
37
-
38
-
39
-
40
-
41
-
42
-
43
-
44
-
45
-
46
-
47
-
48
-
49
-
50
-
51
-
52
-
53
-
54
-
55
-
56
-
57
-
58
-
59
-
60
-
61
-
62
-
63
-
64
-
65
-
66
-
67
-
 68
68 -
 69
69 -
 70
70 -
 71
71 -
 72
72 -
 73
73 -
 74
74 -
 75
75 -
 76
76 -
 77
77 -
 78
78 -
 79
79 -
 80
80 -
 81
81 -
 82
82 -
 83
83 -
 84
84 -
 85
85 -
 86
86 -
 87
87 -
 88
88 -
89
-
90
-
91
-
92
-
93
-
94
-
95
-
96
-
97
-
98
 |
 |

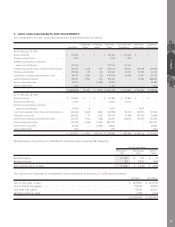
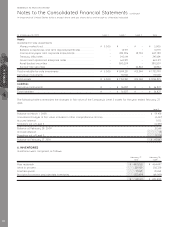
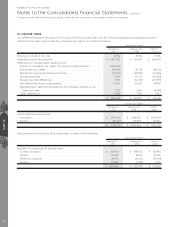
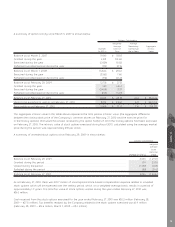
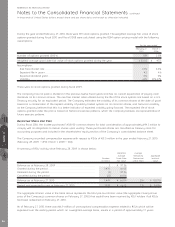
As at February 28, 2009 Level 1 Level 2 Level 3 Total
Assets
Available-for-sale investments
Money market fund ................................................................... $ 5,000 $ – $ – $ 5,000
Bankers acceptances and term deposits/certificates.................. – 14,971 – 14,971
Commerical paper and corporate notes/bonds ......................... – 389,086 18,702 407,788
Treasury bills/notes ................................................................... – 245,614 – 245,614
Government sponsored enterprise notes .................................... – 669,371 – 669,371
Asset-backed securities ............................................................. – 380,209 – 380,209
Auction-rate securities................................................................ – – 32,842 32,842
Total available-for-sale investments .............................................. $ 5,000 $ 1,699,251 $ 51,544 $ 1,755,795
Derivative instruments................................................................... – 70,100 – 70,100
Total assets .................................................................................. $ 5,000 $ 1,769,351 $ 51,544 $ 1,825,895
Liabilities
Derivative instruments................................................................... $ – $ 56,827 $ – $ 56,827
Total liabilities............................................................................... $ – $ 56,827 $ – $ 56,827
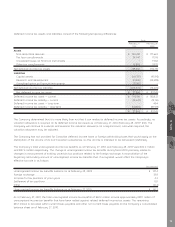
The following table summarizes the changes in fair value of the Company’s Level 3 assets for the year ended February 27,
2010:
Level 3
Balance at March 1, 2008 ................................................................................................................................ $ 59,418
Unrealized changes in fair value included in other comprehensive income ...................................................... (4,457)
Accrued interest .............................................................................................................................................. 1,072
Transfers out of Level 3 ................................................................................................................................... (4,489)
Balance at February 28, 2009 ......................................................................................................................... 51,544
Accrued interest .............................................................................................................................................. (3)
Transfers out of Level 3 ................................................................................................................................... (3,574)
Balance at February 27, 2010 .......................................................................................................................... $ 47,967
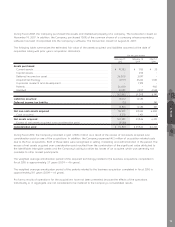
6. INVENTORIES
Inventories were comprised as follows:
February 27,
2010
February 28,
2009
Raw materials ..................................................................................................................... $ 490,063 $ 464,497
Work in process .................................................................................................................. 231,939 250,728
Finished goods.................................................................................................................... 17,068 35,264
Provision for excess and obsolete inventories ...................................................................... (117,459) (68,089)
$ 621,611 $ 682,400
RESEARCH IN MOTION LIMITED
Notes to the Consolidated Financial Statements continued
In thousands of United States dollars, except share and per share data, and except as otherwise indicated
NOTES 5 6
70