Blackberry 2007 Annual Report Download - page 99
Download and view the complete annual report
Please find page 99 of the 2007 Blackberry annual report below. You can navigate through the pages in the report by either clicking on the pages listed below, or by using the keyword search tool below to find specific information within the annual report.-
 1
1 -
2
-
3
-
4
-
5
-
6
-
7
-
8
-
9
-
10
-
11
-
12
-
13
-
14
-
15
-
16
-
17
-
18
-
19
-
20
-
21
-
22
-
23
-
24
-
25
-
26
-
27
-
28
-
29
-
30
-
31
-
32
-
33
-
34
-
35
-
36
-
37
-
38
-
39
-
40
-
41
-
42
-
43
-
44
-
45
-
46
-
47
-
48
-
49
-
50
-
51
-
52
-
53
-
54
-
55
-
56
-
57
-
58
-
59
-
60
-
61
-
62
-
63
-
64
-
65
-
66
-
67
-
68
-
69
-
70
-
71
-
72
-
73
-
74
-
75
-
76
-
77
-
78
-
79
-
80
-
81
-
82
-
83
-
84
-
85
-
86
-
87
-
88
-
 89
89 -
 90
90 -
 91
91 -
 92
92 -
 93
93 -
 94
94 -
 95
95 -
 96
96 -
 97
97 -
 98
98 -
 99
99 -
 100
100 -
 101
101 -
 102
102 -
 103
103 -
 104
104 -
 105
105 -
 106
106
 |
 |

97
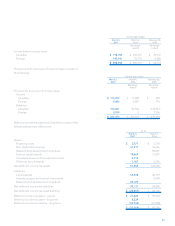
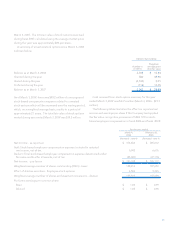
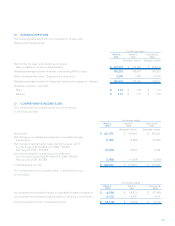
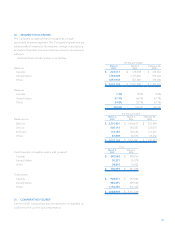
16. EARNINGS PER SHARE
The following table sets forth the computation of basic and
diluted earnings per share.
For the year ended
March 3,
2007 March 4,
2006 February 26,
2005
(Restated - note 4) (Restated - note 4)
Net income for basic and diluted earnings per
share available to common shareholders $ 631,572 $ 374,656 $ 205,612
Weighted-average number of shares outstanding (000’s) - basic 185,353 188,914 187,653
Effect of dilutive securities: Employee stock options 5,250 7,242 10,378
Weighted-average number of shares and assumed conversions - diluted 190,603 196,156 198,031
Earnings per share - reported
Basic $ 3.41 $ 1.98 $ 1.10
Diluted $ 3.31 $ 1.91 $ 1.04
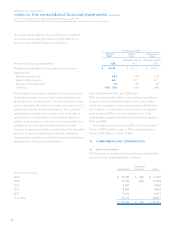
17. COMPREHENSIVE INCOME (LOSS)
The components of comprehensive income are shown
in the following table:
For the year ended
March 3,
2007 March 4,
2006 February 26,
2005
(Restated - note 4) (Restated - note 4)
Net income $ 631,572 $ 374,656 $ 205,612
Net change in unrealized gains (losses) on available-for-sale
investments 11,839 (5,888) (18,357)
Net change in derivative fair value during the year, net of
income taxes of $7,124 (March 4, 2006 - $9,539;
February 26, 2005 - $10,429) (13,455) 18,029 8,446
Amounts reclassified to earnings during the year,
net of income taxes of $4,197 (March 4, 2006 - $6,000;
February 26, 2005 - $5,359) (7,926) (11,344) (4,340)
Comprehensive income $ 622,030 $ 375,453 $ 191,361
The components of accumulated other comprehensive loss
are as follows:
For the year ended
March 3,
2007 March 4,
2006 February 26,
2005
Accumulated net unrealized losses on available-for-sale investments $ (6,394) $ (18,233) $ (12,345)
Accumulated net unrealized gains (losses) on derivative instruments (5,122) 16,259 9,574
Total accumulated other comprehensive loss $ (11,516) $ (1,974) $ (2,771)