Blackberry 2007 Annual Report Download - page 28
Download and view the complete annual report
Please find page 28 of the 2007 Blackberry annual report below. You can navigate through the pages in the report by either clicking on the pages listed below, or by using the keyword search tool below to find specific information within the annual report.-
 1
1 -
2
-
3
-
4
-
5
-
6
-
7
-
8
-
9
-
10
-
11
-
12
-
13
-
14
-
15
-
16
-
17
-
 18
18 -
 19
19 -
 20
20 -
 21
21 -
 22
22 -
 23
23 -
 24
24 -
 25
25 -
 26
26 -
 27
27 -
 28
28 -
 29
29 -
 30
30 -
 31
31 -
 32
32 -
 33
33 -
 34
34 -
 35
35 -
 36
36 -
 37
37 -
 38
38 -
39
-
40
-
41
-
42
-
43
-
44
-
45
-
46
-
47
-
48
-
49
-
50
-
51
-
52
-
53
-
54
-
55
-
56
-
57
-
58
-
59
-
60
-
61
-
62
-
63
-
64
-
65
-
66
-
67
-
68
-
69
-
70
-
71
-
72
-
73
-
74
-
75
-
76
-
77
-
78
-
79
-
80
-
81
-
82
-
83
-
84
-
85
-
86
-
87
-
88
-
89
-
90
-
91
-
92
-
93
-
94
-
95
-
96
-
97
-
98
-
99
-
100
-
101
-
102
-
103
-
104
-
105
-
106
 |
 |

26
RESEARCH IN MOTION LIMITED
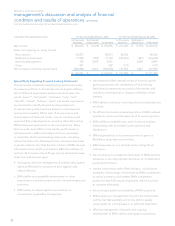
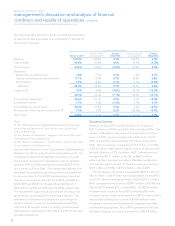
management’s discussion and analysis of financial
condition and results of operations continued
FOR THE THREE MONTHS AND FISCAL YEAR ENDED MARCH 3, 2007
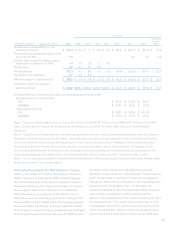
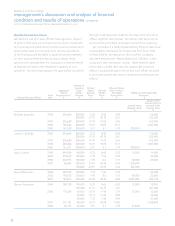
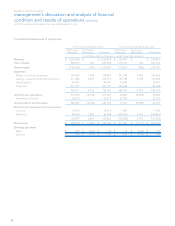
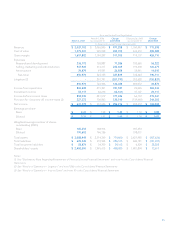
Consolidated Statements of Operations
For the Year Ended March 4, 2006 For the Year Ended February 26, 2005
As Previously
Reported
Restatement
Adjustments As Restated
As Previously
Reported
Restatement
Adjustments As Restated
( United States dollars, in thousands, except for per share amounts )
Revenue $ 2,065,845 $ - $ 2,065,845 $ 1,350,447 $ - $ 1,350,447
Cost of sales 925,215 383 925,598 635,914 396 636,310
Gross margin 1,140,630 (383) 1,140,247 714,533 (396) 714,137
Expenses
Research and development 157,629 1,258 158,887 101,180 1,485 102,665
Selling, marketing and administration 311,420 2,897 314,317 190,730 3,108 193,838
Amortization 49,951 - 49,951 35,941 - 35,941
Litigation 201,791 - 201,791 352,628 - 352,628
720,791 4,155 724,946 680,479 4,593 685,072
Income from operations 419,839 (4,538) 415,301 34,054 (4,989) 29,065
Investment income 66,218 - 66,218 37,107 - 37,107
Income before income taxes 486,057 (4,538) 481,519 71,161 (4,989) 66,172
Provision for (recovery of) income taxes
Current 14,515 - 14,515 1,425 - 1,425
Deferred 89,464 2,884 92,348 (143,651) 2,786 (140,865)
103,979 2,884 106,863 (142,226) 2,786 (139,440)
Net income $ 382,078 $ (7,422) $ 374,656 $ 213,387 $ (7,775) $ 205,612
Earnings per share
Basic $ 2.02 $ (0.04) $ 1.98 $ 1.14 $ (0.04) $ 1.10
Diluted $ 1.96 $ (0.05) $ 1.91 $ 1.09 $ (0.05) $ 1.04