Blackberry 2007 Annual Report Download - page 37
Download and view the complete annual report
Please find page 37 of the 2007 Blackberry annual report below. You can navigate through the pages in the report by either clicking on the pages listed below, or by using the keyword search tool below to find specific information within the annual report.-
 1
1 -
2
-
3
-
4
-
5
-
6
-
7
-
8
-
9
-
10
-
11
-
12
-
13
-
14
-
15
-
16
-
17
-
18
-
19
-
20
-
21
-
22
-
23
-
24
-
25
-
26
-
 27
27 -
 28
28 -
 29
29 -
 30
30 -
 31
31 -
 32
32 -
 33
33 -
 34
34 -
 35
35 -
 36
36 -
 37
37 -
 38
38 -
 39
39 -
 40
40 -
 41
41 -
 42
42 -
 43
43 -
 44
44 -
 45
45 -
 46
46 -
 47
47 -
48
-
49
-
50
-
51
-
52
-
53
-
54
-
55
-
56
-
57
-
58
-
59
-
60
-
61
-
62
-
63
-
64
-
65
-
66
-
67
-
68
-
69
-
70
-
71
-
72
-
73
-
74
-
75
-
76
-
77
-
78
-
79
-
80
-
81
-
82
-
83
-
84
-
85
-
86
-
87
-
88
-
89
-
90
-
91
-
92
-
93
-
94
-
95
-
96
-
97
-
98
-
99
-
100
-
101
-
102
-
103
-
104
-
105
-
106
 |
 |

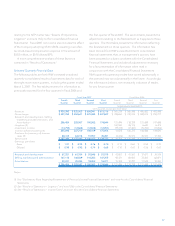
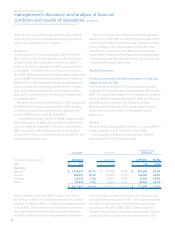
35
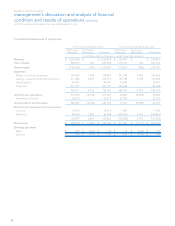
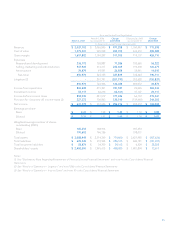
As at and for the Fiscal Year Ended
March 3, 2007
March 4, 2006
(as restated) (1) Change
2007/2006
February 26, 2005
(as restated) (1) Change
2006/2005
(in thousands, except for per share amounts)
Revenue $ 3,037,103 $ 2,065,845 $ 971,258 $ 1,350,447 $ 715,398
Cost of sales 1,379,301 925,598 453,703 636,310 289,288
Gross margin 1,657,802 1,140,247 517,555 714,137 426,110
Expenses
Research and development 236,173 158,887 77,286 102,665 56,222
Selling, marketing and administration 537,922 314,317 223,605 193,838 120,479
Amortization 76,879 49,951 26,928 35,941 14,010
Sub-total 850,974 523,155 327,819 332,444 190,711
Litigation (2) -201,791 (201,791) 352,628 (150,837)
850,974 724,946 126,028 685,072 39,874
Income from operations 806,828 415,301 391,527 29,065 386,236
Investment income 52,117 66,218 (14,101) 37,107 29,111
Income before income taxes 858,945 481,519 377,426 66,172 415,347
Provision for (recovery of) income taxes (3) 227,373 106,863 120,510 (139,440) 246,303
Net income $ 631,572 $ 374,656 $ 256,916 $ 205,612 $ 169,044
Earnings per share
Basic $ 3.41 $ 1.98 $ 1.43 $ 1.10 $ 0.88
Diluted $ 3.31 $ 1.91 $ 1.40 $ 1.04 $ 0.87
Weighted-average number of shares
outstanding (000’s)
Basic 185,353 188,914 187,653
Diluted 190,603 196,156 198,031
Total assets $ 3,088,949 $ 2,314,349 $ 774,600 $ 2,621,985 $ (307,636)
Total liabilities $ 605,449 $ 318,934 $ 286,515 $ 640,181 $ (321,247)
Total long-term liabilities $ 58,874 $ 34,709 $ 24,165 $ 6,504 $ 28,205
Shareholders’ equity $ 2,483,500 $ 1,995,415 $ 488,085 $ 1,981,804 $ 13,611
Notes:
(1) See “Explanatory Note Regarding Restatement of Previously Issued Financial Statements” and note 4 to the Consolidated Financial
Statements.
(2) See “Results of Operations – Litigation” and note 13(b) to the Consolidated Financial Statements.
(3) See “Results of Operations – Income Taxes” and note 10 to the Consolidated Financial Statements.