Blackberry 2007 Annual Report Download - page 44
Download and view the complete annual report
Please find page 44 of the 2007 Blackberry annual report below. You can navigate through the pages in the report by either clicking on the pages listed below, or by using the keyword search tool below to find specific information within the annual report.-
 1
1 -
2
-
3
-
4
-
5
-
6
-
7
-
8
-
9
-
10
-
11
-
12
-
13
-
14
-
15
-
16
-
17
-
18
-
19
-
20
-
21
-
22
-
23
-
24
-
25
-
26
-
27
-
28
-
29
-
30
-
31
-
32
-
33
-
 34
34 -
 35
35 -
 36
36 -
 37
37 -
 38
38 -
 39
39 -
 40
40 -
 41
41 -
 42
42 -
 43
43 -
 44
44 -
 45
45 -
 46
46 -
 47
47 -
 48
48 -
 49
49 -
 50
50 -
 51
51 -
 52
52 -
 53
53 -
 54
54 -
55
-
56
-
57
-
58
-
59
-
60
-
61
-
62
-
63
-
64
-
65
-
66
-
67
-
68
-
69
-
70
-
71
-
72
-
73
-
74
-
75
-
76
-
77
-
78
-
79
-
80
-
81
-
82
-
83
-
84
-
85
-
86
-
87
-
88
-
89
-
90
-
91
-
92
-
93
-
94
-
95
-
96
-
97
-
98
-
99
-
100
-
101
-
102
-
103
-
104
-
105
-
106
 |
 |

42
RESEARCH IN MOTION LIMITED
management’s discussion and analysis of financial
condition and results of operations continued
FOR THE THREE MONTHS AND FISCAL YEAR ENDED MARCH 3, 2007
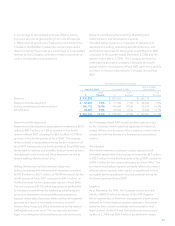
deferred income tax provision as a result of a favorable tax
ruling involving another Canadian technology corporation,
which is also applicable to the Company.
Net Income
The Company’s net income increased by $256.9 million to
$631.6 million, or $3.41 per share basic and $3.31 per share
diluted, in fiscal 2007 compared to net income of $374.7
million, or $1.98 per share basic and $1.91 per share diluted,
in fiscal 2006. The $256.9 million increase in net income in
fiscal 2007 reflects primarily an increase in gross margin in the
amount of $517.6 million, which was offset by an increase of
$300.9 million in the Company’s research and development
expenses, sales and marketing programs and an increase in
legal, accounting and other professional costs incurred in
fiscal 2007 in connection with the Review, the Restatement
and related matters.
Results for the fiscal year ended March 3, 2007 also include
the effect of the Company adopting SFAS 123(R), resulting
in an after-tax stock-based compensation expense in the
amount of $18.8 million, or $0.10 diluted EPS.
The weighted average number of shares outstanding was
185.4 million common shares for basic EPS and 190.6 million
common shares for diluted EPS for the year ended March 3,
2007, compared to 188.9 million common shares for basic
EPS and 196.2 million common shares for diluted EPS for the
comparable period last year.
The income tax benefit of the stock-based compensation
adjustments in fiscal 2006 and 2005, which amounted to $3.6
million and $3.8 million respectively, was originally recorded
by the Company in the fourth quarter of fiscal 2005 and
each of the four quarters in fiscal 2006 and are discussed
above under “Explanatory Note Regarding the Restatement
of Previously Issued Financial Statements” and note 4 to the
Consolidated Financial Statements.
Results of Operations
Fiscal year ended March 4, 2006 compared to the fiscal year
ended February 26, 2005
The fiscal year ended March 4, 2006 comprised 53 weeks
compared to 52 weeks for the fiscal year ended February 26,
2005. The consolidated statements of operations information
below for the fiscal years ended March 4, 2006 and February
26, 2005 has been restated. See “Explanatory Note
Regarding the Restatement of Previously Issued Financial
Statements” and note 4 to the Consolidated Financial
Statements.
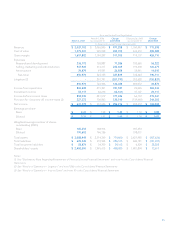
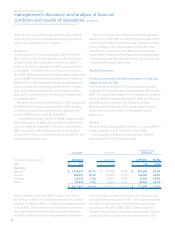
Revenue
Revenue for fiscal 2006 was $2.07 billion, an increase of $715.4
million, or 53.0%, from $1.35 billion for fiscal 2005.
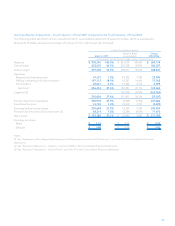
A comparative breakdown of the significant revenue
streams is set forth in the following table:
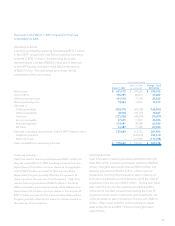
Fiscal 2006 Fiscal 2005 Change - Fiscal
2006/2005
Number of devices sold 4,043,000 2,444,000 1,599,000 65.4%
ASP $ 356 $ 382 $ (26) (6.8%)
Revenues
Devices $ 1,439,674 69.7% $ 933,989 69.2% $ 505,685 54.1%
Service 383,021 18.5% 235,015 17.4% 148,006 63.0%
Software 156,556 7.6% 131,811 9.8% 24,745 18.8%
Other 86,594 4.2% 49,632 3.6% 36,962 74.5%
$ 2,065,845 100.0% $ 1,350,447 100.0% $ 715,398 53.0%
Device revenue increased by $505.7 million, or 54.1%, to
$1.44 billion, or 69.7% of consolidated revenue in fiscal 2006
compared to $934.0 million, or 69.2% of consolidated revenue
in fiscal 2005. This increase in device revenue over the prior
fiscal year was primarily attributable to a volume increase
of 65.4%, or 1.60 million units, to approximately 4.04 million
units from approximately 2.44 million units in the prior year,
partially offset by a decrease in ASP. The Company launched
a number of new products in fiscal 2006 and had devices
operating on the GPRS, iDEN, EDGE, CDMA and Ev-DO
wireless networks and expanded its customer base of carrier
customers, which accounted for the volume growth. ASP