Blackberry 2007 Annual Report Download - page 49
Download and view the complete annual report
Please find page 49 of the 2007 Blackberry annual report below. You can navigate through the pages in the report by either clicking on the pages listed below, or by using the keyword search tool below to find specific information within the annual report.-
 1
1 -
2
-
3
-
4
-
5
-
6
-
7
-
8
-
9
-
10
-
11
-
12
-
13
-
14
-
15
-
16
-
17
-
18
-
19
-
20
-
21
-
22
-
23
-
24
-
25
-
26
-
27
-
28
-
29
-
30
-
31
-
32
-
33
-
34
-
35
-
36
-
37
-
38
-
 39
39 -
 40
40 -
 41
41 -
 42
42 -
 43
43 -
 44
44 -
 45
45 -
 46
46 -
 47
47 -
 48
48 -
 49
49 -
 50
50 -
 51
51 -
 52
52 -
 53
53 -
 54
54 -
 55
55 -
 56
56 -
 57
57 -
 58
58 -
 59
59 -
60
-
61
-
62
-
63
-
64
-
65
-
66
-
67
-
68
-
69
-
70
-
71
-
72
-
73
-
74
-
75
-
76
-
77
-
78
-
79
-
80
-
81
-
82
-
83
-
84
-
85
-
86
-
87
-
88
-
89
-
90
-
91
-
92
-
93
-
94
-
95
-
96
-
97
-
98
-
99
-
100
-
101
-
102
-
103
-
104
-
105
-
106
 |
 |

47
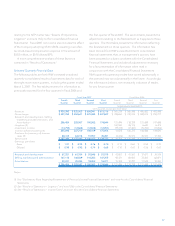
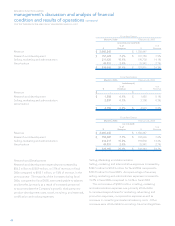
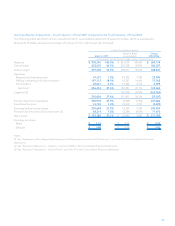
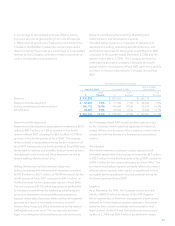
Summary Results of Operations – Fourth Quarter of Fiscal 2007 Compared to the Fourth Quarter of Fiscal 2006
The following table sets forth certain unaudited interim consolidated statement of operations data, which is expressed in
thousands of dollars and as a percentage of revenue for the interim periods indicated:
For the Three Months Ended
March 3, 2007 March 4, 2006
(as restated) (1) Change
2007/2006
(in thousands, except for percentages and per share amounts)
Revenue $ 930,393 100.0% $ 561,219 100.0% $ 369,174
Cost of sales 433,035 46.5% 252,708 45.0% 180,327
Gross margin 497,358 53.5% 308,511 55.0% 188,847
Expenses
Research and development 67,321 7.2% 44,322 7.9% 22,999
Selling, marketing and administration 167,112 18.0% 93,347 16.6% 73,765
Amortization 22,021 2.4% 15,322 2.7% 6,699
Sub-total 256,454 27.6% 152,991 27.3% 103,463
Litigation (2) - - 162,500 29.0% (162,500)
256,454 27.6% 315,491 56.2% (59,037)
Income (loss) from operations 240,904 25.9% (6,980) (1.2%) 247,884
Investment income 14,794 1.6% 19,219 3.4% (4,425)
Earnings before income taxes 255,698 27.5% 12,239 2.2% 243,459
Provision for (recovery of) income taxes (3) 68,314 7.3% (3,356) (0.6%) 71,670
Net income $ 187,384 20.1% $ 15,595 2.8% $ 171,789
Earnings per share
Basic $ 1.01 $ 0.08 $ 0.93
Diluted $ 0.98 $ 0.08 $ 0.90
Notes:
(1) See “Explanatory Note Regarding Restatement of Previously Issued Financial Statements” and note 4 to the Consolidated Financial
Statements.
(2) See “Results of Operations – Litigation” and note 13(b) to the Consolidated Financial Statements.
(3) See “Results of Operations – Income Taxes” and note 10 to the Consolidated Financial Statements.