Blackberry 2007 Annual Report Download - page 84
Download and view the complete annual report
Please find page 84 of the 2007 Blackberry annual report below. You can navigate through the pages in the report by either clicking on the pages listed below, or by using the keyword search tool below to find specific information within the annual report.-
 1
1 -
2
-
3
-
4
-
5
-
6
-
7
-
8
-
9
-
10
-
11
-
12
-
13
-
14
-
15
-
16
-
17
-
18
-
19
-
20
-
21
-
22
-
23
-
24
-
25
-
26
-
27
-
28
-
29
-
30
-
31
-
32
-
33
-
34
-
35
-
36
-
37
-
38
-
39
-
40
-
41
-
42
-
43
-
44
-
45
-
46
-
47
-
48
-
49
-
50
-
51
-
52
-
53
-
54
-
55
-
56
-
57
-
58
-
59
-
60
-
61
-
62
-
63
-
64
-
65
-
66
-
67
-
68
-
69
-
70
-
71
-
72
-
73
-
 74
74 -
 75
75 -
 76
76 -
 77
77 -
 78
78 -
 79
79 -
 80
80 -
 81
81 -
 82
82 -
 83
83 -
 84
84 -
 85
85 -
 86
86 -
 87
87 -
 88
88 -
 89
89 -
 90
90 -
 91
91 -
 92
92 -
 93
93 -
 94
94 -
95
-
96
-
97
-
98
-
99
-
100
-
101
-
102
-
103
-
104
-
105
-
106
 |
 |

82
RESEARCH IN MOTION LIMITED
notes to the consolidated financial statements continued
For the Years Ended March 3, 2007, March 4, 2006 and February 26, 2005
In thousands of United States dollars, except share and per share data, and except as otherwise indicated
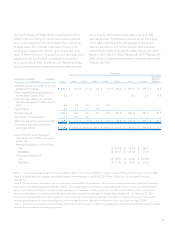
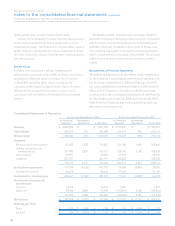
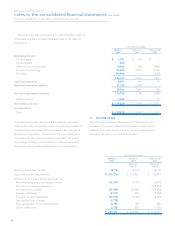
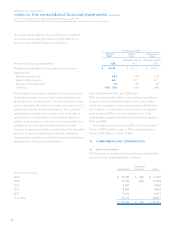
The following is a summary of the effect of these adjustments
on the Company’s pro forma calculation of its net income
per share for the year ended March 4, 2006 and
February 26, 2005:
For the year ended March 4,
2006 For the year ended February 26,
2005
(As
previously
reported) (Restated -
note 4)
(As
previously
reported) (Restated -
note 4)
Net income - as reported $ 382,078 $ 374,656 $ 213,387 $ 205,612
Add: Stock-based employee compensation expense included in
reported net income, net of tax - 5,942 - 6,676
Deduct: Stock-based employee compensation expense
determined under the fair value method for all awards, net of tax (22,022) (25,000) (22,487) (27,176)
Pro forma net income $ 360,056 $ 355,598 $ 190,900 $ 185,112
Net income per share:
Basic net income per common share $ 2.02 $ 1.98 $ 1.14 $ 1.10
Diluted net income per share $ 1.96 $ 1.91 $ 1.09 $ 1.04
Basic net income per common share - pro forma $ 1.91 $ 1.88 $ 1.02 $ 0.99
Diluted net income per share - pro forma $ 1.86 $ 1.82 $ 0.98 $ 0.94
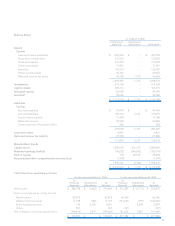
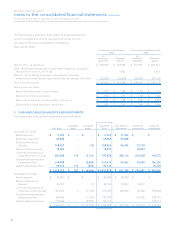
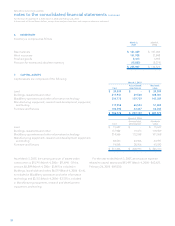
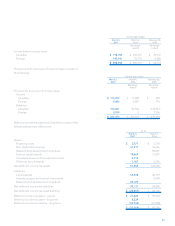
5. CASH AND CASH EQUIVALENTS AND INVESTMENTS
The components of cash and investments were as follows:
Cost Basis Unrealized
Gains Unrealized
Losses Recorded
Basis Cash and Cash
Equivalents Short-term
Investments Long-term
Investments
As at March 3, 2007
Bank balances $ 11,252 $ - $ - $ 11,252 $ 11,252 $ - $ -
Bank term deposits 69,868 - - 69,868 69,868 - -
Bank certificates of
deposit 108,472 - (10) 108,462 96,344 12,118 -
Auction-rate securities 18,423 - - 18,423 - 18,423 -
Commercial paper and
corporate notes / bonds 800,846 119 (3,131) 797,834 449,113 204,149 144,572
Government sponsored
enterprise notes 314,998 - (2,683) 312,315 50,567 75,392 186,356
Asset-backed securities 95,413 113 (802) 94,724 - - 94,724
$ 1,419,272 $ 232 $ (6,626) $ 1,412,878 $ 677,144 $ 310,082 $ 425,652
As at March 4, 2006
Bank balances $ 80,825 $ - $ - $ 80,825 $ 80,825 $ - $ -
Bank certificates of
deposit 44,127 - (1) 44,126 30,053 14,073 -
Commercial paper and
corporate notes / bonds 623,037 5 (7,572) 615,470 348,662 27,380 239,428
Government sponsored
enterprise notes 380,084 - (7,814) 372,270 - 134,100 238,170
Asset-backed securities 139,562 - (2,851) 136,711 - - 136,711
$ 1,267,635 $ 5 $ (18,238) $ 1,249,402 $ 459,540 $ 175,553 $ 614,309