Berkshire Hathaway 2007 Annual Report Download - page 57
Download and view the complete annual report
Please find page 57 of the 2007 Berkshire Hathaway annual report below. You can navigate through the pages in the report by either clicking on the pages listed below, or by using the keyword search tool below to find specific information within the annual report.-
 1
1 -
2
-
3
-
4
-
5
-
6
-
7
-
8
-
9
-
10
-
11
-
12
-
13
-
14
-
15
-
16
-
17
-
18
-
19
-
20
-
21
-
22
-
23
-
24
-
25
-
26
-
27
-
28
-
29
-
30
-
31
-
32
-
33
-
34
-
35
-
36
-
37
-
38
-
39
-
40
-
41
-
42
-
43
-
44
-
45
-
46
-
 47
47 -
 48
48 -
 49
49 -
 50
50 -
 51
51 -
 52
52 -
 53
53 -
 54
54 -
 55
55 -
 56
56 -
 57
57 -
 58
58 -
 59
59 -
 60
60 -
 61
61 -
 62
62 -
 63
63 -
 64
64 -
 65
65 -
 66
66 -
 67
67 -
68
-
69
-
70
-
71
-
72
-
73
-
74
-
75
-
76
-
77
-
78
 |
 |

56
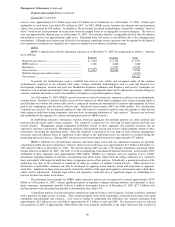
Management’s Discussion (Continued)
Insurance — Investment Income (Continued)
Invested assets derive from shareholder capital and reinvested earnings as well as net liabilities assumed under
insurance contracts or “float.” The major components of float are unpaid losses, unearned premiums and other liabilities to
policyholders less premiums and reinsurance receivables, deferred charges assumed under retroactive reinsurance contracts and
deferred policy acquisition costs. Float approximated $59 billion at December 31, 2007, $51 billion at December 31, 2006 and
$49 billion at December 31, 2005. The increase in float in 2007 was principally due to the Equitas reinsurance transaction. The
cost of float, as represented by the ratio of underwriting gain or loss to average float, was negative for the last three years, as
Berkshire’ s insurance businesses generated underwriting gains in each year.
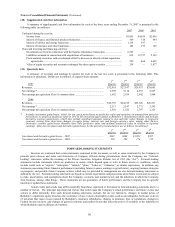
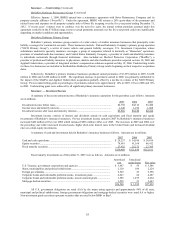
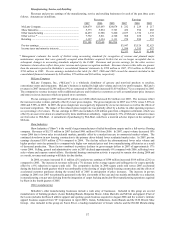
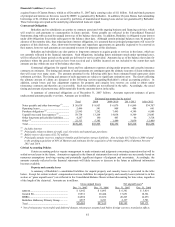
Utilities and Energy (“MidAmerican”)
Revenues and earnings of MidAmerican for each of the past three years are summarized below. Amounts are in
millions.
Revenues Earnings
2007 2006 2005 2007 2006 2005
MidAmerican Energy Company ............................... $ 4,325 $ 3,519 $3,200 $ 412 $ 348 $ 288
PacifiCorp .................................................................. 4,319 2,971 — 692 356 —
Natural gas pipelines.................................................. 1,088 972 909 473 376 309
U.K. utilities............................................................... 1,114 961 921 337 338 308
Real estate brokerage................................................. 1,511 1,724 1,894 42 74 148
Other .......................................................................... 271 497 356 130 245 124
$12,628 $10,644 $7,280
Earnings before corporate interest and taxes............. 2,086 1,737 1,177
Interest, other than to Berkshire ................................ (312) (261) (200)
Interest on Berkshire junior debt ............................... (108) (134) (157)
Income taxes and minority interests **..................... (477) (426) (257)
Net earnings ................................................... $ 1,189 $ 916 $ 563
Earnings applicable to Berkshire *............................ $ 1,114 $ 885 $ 523
Debt owed to others at December 31 ........................ 19,002 16,946 10,296
Debt owed to Berkshire at December 31 .................. 821 1,055 1,289
* Net of minority interests and includes interest earned by Berkshire (net of related income taxes).
** Net of $58 million deferred income tax benefit in 2007 as a result of the reduction in the United Kingdom corporate income
tax rate from 30% to 28% which was enacted during the third quarter of 2007 and will be effective in 2008. Includes
additional income tax charges of $49 million in 2005 related to Berkshire’s accounting for MidAmerican under the equity
method.
Revenues in 2007 from MidAmerican Energy Company (“MEC”) increased $806 million (23%) over 2006. MEC’ s
non-regulated energy sales in 2007 exceeded 2006 by $597 million primarily due to increased electric sales volume and prices
driven by improved market opportunities. MEC’ s regulated retail and wholesale electricity sales in 2007 exceeded 2006 by $155
million, which reflected the impact of new generating assets in 2007 and improved market opportunities in wholesale markets as
well as higher unit sales attributable to warmer summer temperatures and increases in the average number of retail customers.
Earnings before corporate interest and taxes (“EBIT”) of MEC in 2007 increased $64 million (18%), reflecting the margins on
the increases in regulated and nonregulated energy sales, partially offset by higher facilities operating and maintenance costs.
Revenues in 2007 from PacifiCorp increased $1,348 million (45%) versus 2006. Revenues and EBIT of PacifiCorp for
2006 in the preceding table are included beginning as of the acquisition date (March 21, 2006). EBIT of PacifiCorp in 2007
increased $336 million (94%) versus 2006. In 2007, PacifiCorp’ s revenues and EBIT were favorably impacted by regulatory-
approved rate increases and higher customer usage in retail markets, as well as increased margins on wholesale electricity sales,
partially offset by higher fuel and purchased power costs. Fuel costs increased due to the higher volumes and because of higher
average unit costs.
Revenues in 2007 from natural gas pipelines increased $116 million (12%) over 2006 due primarily to higher demand
and rates resulting from favorable market conditions and because revenues in 2006 reflected the impact of estimated rate case
refunds to customers with respect to an order by the Federal Energy Regulatory Commission. EBIT in 2007 from natural gas
pipelines increased $97 million (26%) over 2006 mainly due to comparatively higher revenue and lower depreciation due to
expected changes in depreciation rates in connection with a current rate proceeding.
Revenues from U.K. utilities in 2007 increased over the comparable 2006 period primarily attributable to the
strengthening of the Pound Sterling versus the U.S. dollar as well as higher gas production and electricity distribution revenues.
EBIT from the U.K. utilities in 2007 was essentially unchanged compared to 2006 as higher maintenance and depreciation costs
and the write-off of unsuccessful gas exploration costs offset the impact of higher revenues.
Revenues and EBIT from real estate brokerage declined 12% and 43%, respectively, compared to 2006, primarily due
to significantly lower transaction volume as a result of the slowdown in U.S. residential real estate activity. Revenues and EBIT
from other activities in 2006 included pre-tax gains of $117 million which was primarily from the disposal of equity securities.
There were no significant securities gains in 2007.