Berkshire Hathaway 2007 Annual Report Download - page 5
Download and view the complete annual report
Please find page 5 of the 2007 Berkshire Hathaway annual report below. You can navigate through the pages in the report by either clicking on the pages listed below, or by using the keyword search tool below to find specific information within the annual report.-
 1
1 -
 2
2 -
 3
3 -
 4
4 -
 5
5 -
 6
6 -
 7
7 -
 8
8 -
 9
9 -
 10
10 -
 11
11 -
 12
12 -
 13
13 -
 14
14 -
 15
15 -
 16
16 -
17
-
18
-
19
-
20
-
21
-
22
-
23
-
24
-
25
-
26
-
27
-
28
-
29
-
30
-
31
-
32
-
33
-
34
-
35
-
36
-
37
-
38
-
39
-
40
-
41
-
42
-
43
-
44
-
45
-
46
-
47
-
48
-
49
-
50
-
51
-
52
-
53
-
54
-
55
-
56
-
57
-
58
-
59
-
60
-
61
-
62
-
63
-
64
-
65
-
66
-
67
-
68
-
69
-
70
-
71
-
72
-
73
-
74
-
75
-
76
-
77
-
78
 |
 |

Insurance float – money we temporarily hold in our insurance operations that does not belong to
us – funds $59 billion of our investments. This float is “free” as long as insurance underwriting breaks
even, meaning that the premiums we receive equal the losses and expenses we incur. Of course, insurance
underwriting is volatile, swinging erratically between profits and losses. Over our entire history, however,
we’ ve been profitable, and I expect we will average breakeven results or better in the future. If we do that,
our investments can be viewed as an unencumbered source of value for Berkshire shareholders.
Berkshire’ s second component of value is earnings that come from sources other than investments
and insurance. These earnings are delivered by our 66 non-insurance companies, itemized on page 76. In
our early years, we focused on the investment side. During the past two decades, however, we have put
ever more emphasis on the development of earnings from non-insurance businesses.
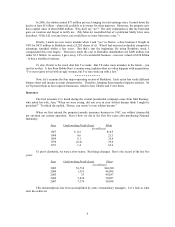
The following tables illustrate this shift. In the first we tabulate per-share investments at 14-year
intervals. We exclude those applicable to minority interests.
Year Per-Share
Investments
Years Compounded Annual
Gain in Per-Share Investments
1965 $ 4
1979 577 1965-1979 42.8%
1993 13,961 1979-1993 25.6%
2007 90,343 1993-2007 14.3%
For the entire 42 years, our compounded annual gain in per-share investments was 27.1%. But the
trend has been downward as we increasingly used our available funds to buy operating businesses.
Here’ s the record on how earnings of our non-insurance businesses have grown, again on a per-
share basis and after applicable minority interests.
Year Per Share
Pre-Tax Earnings
Years Compounded Annual Gain in Per-
Share Pre-Tax Earnings
1965 $ 4
1979 18 1965-1979 11.1%
1993 212 1979-1993 19.1%
2007 4,093 1993-2007 23.5%
For the entire period, the compounded annual gain was 17.8%, with gains accelerating as our
focus shifted.
Though these tables may help you gain historical perspective and be useful in valuation, they are
completely misleading in predicting future possibilities. Berkshire’s past record can’t be duplicated or
even approached. Our base of assets and earnings is now far too large for us to make outsized gains in the
future.
Charlie Munger, my partner at Berkshire, and I will continue to measure our progress by the two
yardsticks I have just described and will regularly update you on the results. Though we can’ t come close
to duplicating the past, we will do our best to make sure the future is not disappointing.
* * * * * * * * * * * *
In our efforts, we will be aided enormously by the managers who have joined Berkshire. This is
an unusual group in several ways. First, most of them have no financial need to work. Many sold us their
businesses for large sums and run them because they love doing so, not because they need the money.
Naturally they wish to be paid fairly, but money alone is not the reason they work hard and productively.
4