Berkshire Hathaway 2007 Annual Report Download - page 43
Download and view the complete annual report
Please find page 43 of the 2007 Berkshire Hathaway annual report below. You can navigate through the pages in the report by either clicking on the pages listed below, or by using the keyword search tool below to find specific information within the annual report.-
 1
1 -
2
-
3
-
4
-
5
-
6
-
7
-
8
-
9
-
10
-
11
-
12
-
13
-
14
-
15
-
16
-
17
-
18
-
19
-
20
-
21
-
22
-
23
-
24
-
25
-
26
-
27
-
28
-
29
-
30
-
31
-
32
-
 33
33 -
 34
34 -
 35
35 -
 36
36 -
 37
37 -
 38
38 -
 39
39 -
 40
40 -
 41
41 -
 42
42 -
 43
43 -
 44
44 -
 45
45 -
 46
46 -
 47
47 -
 48
48 -
 49
49 -
 50
50 -
 51
51 -
 52
52 -
 53
53 -
54
-
55
-
56
-
57
-
58
-
59
-
60
-
61
-
62
-
63
-
64
-
65
-
66
-
67
-
68
-
69
-
70
-
71
-
72
-
73
-
74
-
75
-
76
-
77
-
78
 |
 |

42
Notes to Consolidated Financial Statements (Continued)
(14) Dividend restrictions – Insurance subsidiaries (Continued)
Statutory surplus differs from the corresponding amount determined on the basis of GAAP. The major differences between
statutory basis accounting and GAAP are that deferred charges reinsurance assumed, deferred policy acquisition costs, unrealized
gains and losses on investments in fixed maturity securities and related deferred income taxes are recognized under GAAP but not for
statutory reporting purposes. In addition, statutory accounting for goodwill of acquired businesses requires amortization of goodwill
over 10 years, whereas under GAAP, goodwill is not amortized and is subject to periodic tests for impairment.
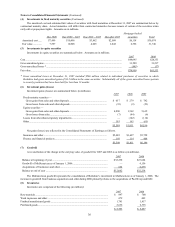
(15) Fair values of financial instruments
The estimated fair values of Berkshire’ s financial instruments as of December 31, 2007 and 2006 are as follows (in millions).
Carrying Value Fair Value
2007 2006 2007 2006
Insurance and other:
Investments in fixed maturity securities....................................................... $28,515 $25,300 $28,515 $25,300
Investments in equity securities ................................................................... 74,999 61,533 74,999 61,533
Notes payable and other borrowings............................................................ 2,680 3,698 2,709 3,815
Finance and financial products:
Investments in fixed maturity securities....................................................... 3,056 3,012 3,231 3,164
Derivative contract assets
(a) ....................................................................... 699 624 699 624
Loans and finance receivables ..................................................................... 12,359 11,498 12,612 11,862
Notes payable and other borrowings............................................................ 12,144 11,961 12,317 11,787
Derivative contract liabilities....................................................................... 6,887 3,883 6,887 3,883
Utilities and energy:
Derivative contract assets
(a) ....................................................................... 397 484 397 484
Notes payable and other borrowings............................................................ 19,002 16,946 19,834 17,789
Derivative contract liabilities
(b).................................................................. 765 889 765 889
(a) Included in Other assets
(b) Included in Accounts payable, accruals and other liabilities
In determining fair value of financial instruments, Berkshire used quoted market prices when available. For instruments where
quoted market prices were not available, independent pricing services or appraisals by Berkshire’ s management were used. The
pricing services and appraisals reflect the estimated present values of future expected cash flows utilizing current risk adjusted market
rates of similar instruments. The carrying values of cash and cash equivalents, accounts receivable and accounts payable, accruals
and other liabilities are deemed to be reasonable estimates of their fair values.
Considerable judgment is required in interpreting market data used to develop the estimates of fair value. Accordingly, the
estimates presented herein are not necessarily indicative of the amounts that could be realized in a current market exchange. The use
of different market assumptions and/or estimation methodologies may have a material effect on the estimated fair value.
(16) Common stock
Changes in issued and outstanding Berkshire common stock during the three years ended December 31, 2007 are shown in the
table below.
Class A Common, $5 Par Value Class B Common, $0.1667 Par Value
(1,650,000 shares authorized) (55,000,000 shares authorized)
Shares Issued and Shares Issued and
Outstanding Outstanding
Balance December 31, 2004.............................................. 1,268,783 8,099,175
Conversions of Class A common stock
to Class B common stock and other............................... (7,863) 294,908
Balance December 31, 2005.............................................. 1,260,920 8,394,083
Conversions of Class A common stock
to Class B common stock and other............................... (143,352) 4,358,348
Balance December 31, 2006.............................................. 1,117,568 12,752,431
Issuance of shares on exercise of SQUARZ warrants ....... 2,325 41,706
Conversions of Class A common stock
to Class B common stock and other............................... (38,869) 1,205,943
Balance December 31, 2007.............................................. 1,081,024 14,000,080