Berkshire Hathaway 2007 Annual Report Download - page 47
Download and view the complete annual report
Please find page 47 of the 2007 Berkshire Hathaway annual report below. You can navigate through the pages in the report by either clicking on the pages listed below, or by using the keyword search tool below to find specific information within the annual report.-
 1
1 -
2
-
3
-
4
-
5
-
6
-
7
-
8
-
9
-
10
-
11
-
12
-
13
-
14
-
15
-
16
-
17
-
18
-
19
-
20
-
21
-
22
-
23
-
24
-
25
-
26
-
27
-
28
-
29
-
30
-
31
-
32
-
33
-
34
-
35
-
36
-
 37
37 -
 38
38 -
 39
39 -
 40
40 -
 41
41 -
 42
42 -
 43
43 -
 44
44 -
 45
45 -
 46
46 -
 47
47 -
 48
48 -
 49
49 -
 50
50 -
 51
51 -
 52
52 -
 53
53 -
 54
54 -
 55
55 -
 56
56 -
 57
57 -
58
-
59
-
60
-
61
-
62
-
63
-
64
-
65
-
66
-
67
-
68
-
69
-
70
-
71
-
72
-
73
-
74
-
75
-
76
-
77
-
78
 |
 |

46
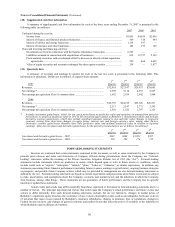
Notes to Consolidated Financial Statements (Continued)
(18) Business segment data (Continued)
Goodwill Identifiable assets
at year-end at year-end
Operating Businesses: 2007 2006 2007 2006
Insurance group:
GEICO............................................................................................. $ 1,372 $ 1,370 $ 18,988 $ 18,544
General Re....................................................................................... 13,532 13,532 32,571 31,114
Berkshire Hathaway Reinsurance and Primary Groups................... 546 465 95,379 85,972
Total insurance group ......................................................................... 15,450 15,367 146,938 135,630
Finance and financial products ........................................................... 1,013 1,012 24,733 23,599
McLane Company .............................................................................. 149 158 3,329 2,986
MidAmerican...................................................................................... 5,543 5,548 33,645 30,942
Shaw Industries................................................................................... 2,339 2,228 2,922 2,776
Other businesses ................................................................................. 8,368 7,925 20,579 17,571
$32,862 $32,238 232,146 213,504
Reconciliation of segments to consolidated amount:
Corporate and other ........................................................................ 8,152 2,695
Goodwill ......................................................................................... 32,862 32,238
$273,160 $248,437
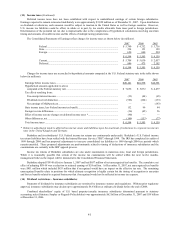
Insurance premiums written by geographic region (based upon the domicile of the insured or reinsured) are summarized below.
Dollars are in millions.
Property/Casualty Life/Health
2007 2006 2005 2007 2006 2005
United States ................................................................ $18,589 $19,195 $16,228 $1,092 $1,073 $1,147
Western Europe............................................................ 9,641 2,576 2,643 706 628 578
All other ....................................................................... 588 638 760 681 667 578
$28,818 $22,409 $19,631 $2,479 $2,368 $2,303
Insurance premiums written and earned in 2007 included $7.1 billion from a single reinsurance transaction with Equitas. See
Note 11 for additional information. Amounts for Western Europe were primarily in the United Kingdom and Germany.
Consolidated sales and service revenues in 2007, 2006 and 2005 were $58.2 billion, $51.8 billion and $46.1 billion, respectively.
Over 90% of such amounts in each year were in the United States with the remainder primarily in Canada and Europe. In 2007,
consolidated sales and service revenues included $10.5 billion of sales to Wal-Mart Stores, Inc. which were primarily related to
McLane’ s wholesale distribution business.
Premiums written and earned by Berkshire’ s property/casualty and life/health insurance businesses are summarized below.
Dollars are in millions.
Property/Casualty Life/Health
2007 2006 2005 2007 2006 2005
Premiums Written:
Direct ........................................................................ $16,056 $15,729 $13,582
Assumed ................................................................... 13,316 7,224 6,788 $2,579 $2,476 $2,400
Ceded ........................................................................ (554) (544) (739) (100) (108) (97)
$28,818 $22,409 $19,631 $2,479 $2,368 $2,303
Premiums Earned:
Direct ........................................................................ $16,076 $15,453 $13,287
Assumed ................................................................... 13,744 6,746 7,114 $2,564 $2,471 $2,387
Ceded ........................................................................ (499) (599) (699) (102) (107) (92)
$29,321 $21,600 $19,702 $2,462 $2,364 $2,295